 AR
AR
Articles (7)

What is technical analysis in trading?
<p>The most important part of any trading strategy is knowing when to enter and exit the market. In our previous trading guides and articles, we covered various factors influencing price movements in financial markets, such as economic indicators and political climate.<br /> <br /> Analysing such factors is called fundamental analysis, and it is a very popular method to evaluate future price movements among traders.<br /> <br /> However, some traders consider insights found with the help of fundamental analysis insufficient to provide exact buy and sell levels. That’s where technical analysis can be useful.</p> <p>In this article, we’ll explain what technical analysis is, how it works, and its main types.</p> <h2>What is technical analysis?</h2> <p>Technical analysis is the process of evaluating past price movements of an instrument to determine its future moves. The reason it’s called technical is because it’s based purely on statistics and is not affected by news, economic or political factors.<br /> <br /> While this method is widely used by traders all over the globe, it’s important to understand that past prices don’t predict or dictate future prices, and all the insights gathered with the help of technical analysis are solely indicative.<br /> <br /> Technical analysis includes multiple tools. An experienced technical analyst usually uses various combinations of them to compare results and make an informed trading decision. These tools can be divided into three categories: trend lines, chart patterns and technical indicators.<br /> <br /> All three analyse price charts. So whichever type you choose, the single most important thing is to learn how to read price charts.</p> <h2>What is a price chart?</h2> <p>A price chart in trading is a graphic sequence of historical prices of an instrument. Charts are at the heart of trading as they help traders to monitor the value of their current positions, analyse past price movements and get cues as to where the price may move next. Understanding how to read a price chart is a key step in learning technical analysis.<br /> <br /> Each trading platform offers a different set of various chart types, and the choice depends purely on a trader’s personal preference. ThinkMarkets’ proprietary platform ThinkTrader, for example, has over 15 different charts to accommodate traders’ needs.<br /> <br /> <img alt="" src="/getmedia/6aae82dc-4ad4-43ba-9b7b-fdbf2373e549/article-what-is-technical-analysis-price-chart-1.webp" style="width: 552px; height: 464px;" /><br /> <br /> Some popular ones are candlestick, bar and line charts:<br /> <br /> <img alt="" src="/getmedia/ffc042b3-bc5a-4a9e-81e8-da5cb1ba5b5c/article-what-is-technical-analysis-chart-types.webp" style="width: 552px; height: 258px;" /><br /> <br /> As a candlestick chart is the most commonly used by traders, let’s see how it works in detail.</p> <h2>Candlestick chart</h2> <p>A candlestick chart is called so because each unit of it looks like a candle. The time frame of candles can be adjusted from one minute to one month, depending on the strategy:<br /> <br /> <img alt="" src="/getmedia/0f95f823-f6c9-42e1-a8f7-dcfb6ace79e7/article-what-is-technical-analysis-candlestick-chart.webp" style="width: 552px; height: 431px;" /><br /> <br /> Regardless of the chosen time frame, each candle consists of two main elements: the wick and the body that represent four prices of an instrument:</p> <ul> <li>Opening price</li> <li>Highest price reached during the chosen period</li> <li>Lowest price reached during the chosen period</li> <li>Closing price</li> </ul> <p><br /> The candles are coloured depending on whether the market rose or fell during the selected timeframe. Green candles (white on some platforms) indicate rising or bullish prices, and red (black) represent falling prices, also called bearish.<br /> <br /> <img alt="" src="/getmedia/38272a03-b39f-4a17-85b3-e0377aacfc0a/article-what-is-technical-analysis-candlestick-wicks.webp" style="width: 552px; height: 327px;" /><br /> <br /> In technical analysis, it is exactly the relationship between individual candlesticks that helps traders predict a future price movement.</p> <h2>Types of technical analysis</h2> <p>As we mentioned above, technical analysis tools can be segregated into three categories: trend lines, chart patterns and technical indicators.</p> <h5>Trend lines</h5> <p>Prices never move in straight lines. Influenced by many factors, they move up and down, forming highs and lows. A trend means the overall direction of the price movements. Trend lines are just straight lines that traders use to connect highs and lows on a price chart to identify a trend. Some trend lines, such as support and resistance, are used to identify an entry and exit level before opening a position.<br /> <br /> In one of our following articles, we’ll explain how trend analysis works and how to identify a trend in detail.</p> <h5>Chart patterns</h5> <p>A chart pattern is a graphic sequence of lines that can be identified on a price chart. Chart patterns are very popular among traders as they can often signal the beginning, end, strengthening or weakening of a trend.<br /> <br /> We’ll go through the most popular patterns in one of our next articles as well and explain how they work.</p> <h5>Technical indicators</h5> <p>Technical analysis indicators are mathematical calculations based on historical data and used to identify price action. As complex as it sounds, traders don’t need to do the actual math. Every trading platform offers technical indicators that can be simply applied to a price chart. The main goal for a trader is to learn how to read them.<br /> <br /> Depending on their types, technical indicators can analyse trend direction and strength and identify potential entry and exit points. We will cover this topic in detail in our following articles too.<br /> <br /> For now, to start getting familiar with technical analysis, we suggest creating a <a href="~/en/demo-account">risk-free demo account</a> on ThinkTrader and studying various price charts. You will be able to use the same platform to continue your journey with technical analysis, as it offers an extensive suite of analytical tools.<br /> </p>
Trendlines in technical analysis: support and resistance explained
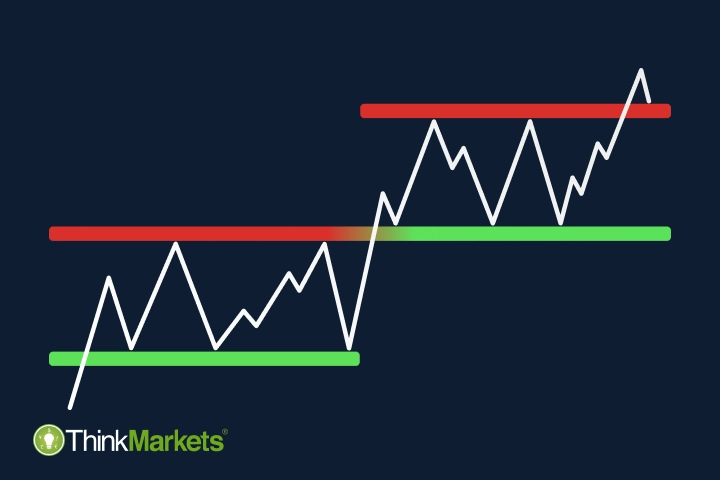
<p>Identifying trends is often a starting point of the technical analysis journey for many beginners, as it's the most beginner-friendly way to find trading opportunities.<br /> <br /> In this article, we'll explain what trendlines are, how support and resistance work and how to spot potential entry points in a market.</p> <h2>What are trendlines?</h2> <p>A trendline is a line connecting two or more price points in a chart. Traders draw this line with the help of various drawing tools offered by almost every trading platform.<br /> <br /> For example, here is a wide selection of drawing tools on ThinkTrader, ThinkMarkets' proprietary trading platform.<br /> <br /> <img alt="Drawing tools on ThinkTrader" src="~/getmedia/d039a5ad-8318-4690-b5c8-01063a5ee1e0/Drawing-tools-on-ThinkTrader.png" /></p> <h2>Support and resistance</h2> <p>Trend lines are used to identify the trend direction of an instrument, and to indicate potential support and resistance.<br /> <br /> Both support and resistance represent levels where a price bounces back and starts moving in the opposite direction.<br /> <br /> <img alt="Support and resistance levels" src="~/getmedia/68c1b4f5-a387-4380-ad1b-d8326d955bd7/Support-and-resistance-levels.png" /><br /> <br /> As you can see in the image, resistance is located on top of the price channel. It is called so because that's where the rising price meets resistance and slows down. On the other hand, the support level is located at the bottom of the price channel that's where the falling price is supported and slowed down.</p> <h2>How do support and resistance work?</h2> <p>Price movements and direction depend on market psychology and how many bullish and bearish traders are active on the market at any given time.<br /> <br /> When the market has more buyers than sellers and subsequently more buy positions than sell positions, it pushes the price higher toward the resistance level. As it approaches the level, traders that bought at lower levels will realise that the price reversed lower from the same price in the past and take the opportunity to lock-in profits. As there are more sellers than buyers at the resistance level, the price will reverse again, and reach a new resistance level.<br /> <br /> There is no set timeframe for identifying the previous price reversal level. It could have happened a few days, weeks or months ago. It is important to note that the more often the price bounced off to the same level in the past, the higher the chances it will happen again. The older the resistance level, the more important it becomes.<br /> <br /> If bullish traders overpower bearish, which means more people buying (going long) than selling (going short), the price rises and breaks through the resistance level. This breakthrough is usually caused by some external news on the market, such as a new monetary policy announcement, that can be identified with the help of fundamental analysis.<br /> <br /> Once the breakout happens, the role of support/resistance usually flips – resistance becomes support, and if the breakout happens in a downward movement, support becomes resistance.<br /> <br /> <img alt="Resistance level reversed into support level" src="~/getmedia/85ee2f59-6c3f-45f2-9598-0ef19d15f71b/Resistance-level-reversed-into-support-level.png" /></p> <h2>How to find support and resistance levels</h2> <p>Both support and resistance can be very helpful tools to identify a potential trading opportunity because once a breakout occurs, it may indicate a potential entry point for a position in the same direction.<br /> <br /> To identify and draw support and resistance in a chart, you need to find and connect the highs and the lows (also called peaks and troughs) of the same price level. You don’t necessarily need to look for both levels simultaneously – even one of them can be quite insightful.<br /> <br /> For example, on the image below, you can see how we identified a level that was both support and resistance during different periods of time.<br /> <br /> <img alt="A valid trend line as both support and resistance." src="~/getmedia/3cb82df4-4120-4601-b438-5916187ef0c1/A-valid-trend-line-as-both-support-and-resistance.png" /><br /> <br /> One more factor to pay attention to is that when the price approaches the support/resistance level or even when it breaks through, it can trigger a lot of hesitation on the market with an equal number of bullish and bearish activities creating sideways price movement.<br /> <br /> Once you find such a movement, you can add an additional support or resistance level there that will serve as an extra suggestion for a trading opportunity.<br /> <br /> For example, on the image below, you see the same <a href="~/en/eur-usd">EUR/USD</a> chart with support and resistance levels and an additional support level:<br /> <br /> <img alt="Additional support level in a price chart" src="~/getmedia/2ebfa33c-4579-4b03-9c80-f648f967225c/Additional-support-level-in-a-price-chart.png" /><br /> <br /> Once you are comfortable with drawing support and resistance, you can step up your technical analysis and try to identify trends.</p> <h2>What are trends in trading?</h2> <p>A trend in trading, just like in any other aspect of life, means a general direction of movement or development. When experienced traders talk about trends and trend trading, they imply the direction of price movements of an instrument.<br /> <br /> All trends are formed by a succession of highs and lows. To identify one, you need to connect these highs and lows in the same manner you did, drawing support and resistance.<br /> <br /> For example, on the image below, we connected the highs of a certain part of the chart with one trendline and the lows with another one. Such formation is called a channel, and the two trendlines essentially serve as support (the lower one) and resistance (the higher one).<br /> <br /> <img alt="How to draw trend lines in a price chart" src="~/getmedia/9a9c2e1a-521c-41cc-a3fa-d4599e5bcb5e/How-to-draw-trend-lines-in-a-price-chart.png" /><br /> <br /> As you can see, the resistance line doesn’t connect all the available highs, as one of them goes through the line. Keep this thought; we’ll explain what it means further in the article.</p> <h2>Bullish, bearing and sideways trends</h2> <p>The direction of the channel can tell us whether a trend is bullish, bearish or sideways – the only three possible types of trends.<br /> <br /> If a trend is upward, it is called bullish. It can also be defined as higher highs and lower lows. A downward trend is considered bearish, as it forms lower highs and lower lows. When highs and lows are not reaching new grounds and moving horizontally instead, a trend is considered sideways.<br /> <br /> <img alt="Bullish, bearish and sideways trends" src="~/getmedia/28a29822-4d0f-42d8-98e0-8ec6c19bbc63/Bullish,-bearish-and-sideways-trends.png" /><br /> <br /> To confirm whether you have identified the correct trend, you need to wait for at least three price movements and analyse their highs and lows. On the image below, you can see how the price formed a higher high first, then a higher low and then moved past the previously formed high; hence we can consider this trend bullish.<br /> <br /> <img alt="Trend formation" src="~/getmedia/8890c69e-3dbf-4b78-8b98-28904bef66bc/Trend-formation.png" /></p> <h2>Trends within trends</h2> <p>There are two ways to look at trends. You can zoom in and consider smaller individual price movements, or you can zoom out and take a look at a bigger trend.<br /> <br /> Charles H. Dow, a founder and co-founder of multiple financial entities, such as the Dow Jones stock index and The Wall Street Journal, developed the Dow theory, where he identified three types of trends by their size:</p> <ul> <li>Minor trend – day-to-day prices; </li> <li>Secondary trend – bigger trends; </li> <li>Primary trend – long-term trends, called bull or bear trends. </li> </ul> <br /> On the image below, you can see a graphic representation of such trends:<br /> <br /> <img alt="Primary, secondary and minor trends graphic." src="~/getmedia/9865d22d-07db-4952-ae4f-4eac931f21b1/Primary,-secondary-and-minor-trends-graphic.png" /><br /> <br /> The next image shows a real-life example of all three trends within each other on a EUR/USD chart:<br /> <br /> <img alt="Primary, secondary and minor trends on a price chart" src="~/getmedia/eff31d3a-a3a2-4557-95cd-4d453d06d821/Primary,-secondary-and-minor-trends-on-a-price-chart.png" /><br /> <br /> Experienced traders tend to use a combination of different trend sizes to find the best trading opportunities. Some start from a primary trend and move inward – to the secondary one, followed by the minor one, while others do the opposite. If, during this research, breakouts overlap in multiple trend channels, it usually indicates a stronger trading signal.<br /> <br /> It can also be useful to switch timeframes to confirm the findings. For example, you can use 1-day candlesticks for primary and secondary trends and 1-hour candlesticks for minor trends identification. There are no set rules; it is up to every trader's individual preference.<br /> <br /> Essentially, no matter which trend size you are looking at, from the technical analysis standpoint, they all follow the same logic. Once the price breaks through the support or resistance, it may indicate a trading opportunity. This happens because trends tend to reverse after the breakout.<br /> <br /> <img alt="Price breakout on a chart." src="~/getmedia/a8466348-db0f-4ed4-82fb-0ceca2653a14/Price-breakout-on-a-chart.png" /> <p> </p> <h2>False breakouts</h2> <p>It is important to keep in mind that a breakout doesn't necessarily mean that the trend will reverse. Sometimes false breakouts occur, and after a short movement through a trendline, the price moves back to the channel.<br /> <br /> <img alt="False breakouts on a price chart." src="~/getmedia/76376df2-fb56-46c3-af81-e0b3bbc7007f/False-breakouts-on-a-price-chart.png" /><br /> <br /> That's why every breakout needs to be studied closely to understand whether the trend is weakening and showing signs of an upcoming reverse. It can be observed when the price stops following the trend's pattern.<br /> <br /> For example, in a bearish trend – lower highs and lower lows – the price suddenly forms a higher or equal high and a higher or equal low:<br /> <br /> <img alt="The signs of trend weaking and trend reverse." src="~/getmedia/913cfcd5-3c2b-4aa2-aebd-401e7225ddbe/The-signs-of-trend-weaking-and-trend-reverse.png" /><br /> <br /> If we zoom in on the breakout on our EUR/USD chart, we can see how It works in a real trading environment:<br /> <br /> <img alt="Studying price data to identify false breakout." src="~/getmedia/bda471ed-0370-43b4-b2e4-7c102aebb831/Studying-price-data-to-identify-false-breakout.png" /><br /> <br /> As we mentioned previously, to confirm a trend, you need to observe at least three price movements following the pattern.<br /> <br /> On the image above, when the price breaks through the resistance level in the upward movement first, the third candle has the same high as the second, which means the trend is weak. Indeed, the price returns to the channel after that, revealing the false breakout.<br /> <br /> On the contrary, the second time the price breaks through the same resistance level, the first three candles have higher highs and higher lows, forming a new bullish trend in an upward movement.<br /> <br /> However, it's important to keep in mind that any indication of a potential trading opportunity you find is no more than just an indication, and it is never a guaranteed signal. Experienced technical analysts use multiple tools to analyse price charts, compare their findings and confirm the probability of a certain price movement in the future. In our following articles, we will talk about chart patterns and technical indicators to equip you with more technical analysis tools.<br /> <br /> Meanwhile, you can practise finding support and resistance levels in a chart with your demo trading account. Identify entry points and see if the price behaves as you predicted in a risk-free trading environment with virtual money.</p>
MT4 tips and tricks
<h2><strong style="color:#007c8c;">Customising charts</strong></h2> <p>You can fully customise your charts with indicators, grids and period separators and can add and remove these as you see fit. Here are some useful keyboard shortcuts for easy removals:<span style="font-size: 1.425rem; line-height: 1.6; font-family: EncodeSans, Helvetica, Arial, sans-serif; font-weight: normal;"> </span></p> <h5><span style="font-size: 1.425rem; line-height: 1.6; font-family: EncodeSans, Helvetica, Arial, sans-serif; font-weight: normal; margin-top: 0px;"><img alt="" src="~/getmedia/ad730baa-a9bd-415e-8ac7-4ae53466cfcf/MT4-Tips-and-Tricks-Custom-Charts_1.PNG" style="vertical-align: middle; margin-top: 0px; " /></span></h5> <p><br /> <strong><img alt="" src="/TMXWebsite/media/TMXWebsite/MT4-Tips-and-Tricks-hide-the-Bid.PNG?width=300&height=204" style="width: 300px; height: 204px; float: left; margin-top: 0px; margin-right:24px; margin-bottom:8px;" />Hiding the bid line</strong><br /> If you use a lot of technical analysis, the bid line can become rather obtrusive. To remove the bid line you can set the colour of the line to ‘None’, completely removing it from the chart.</p> <h5> </h5> <p><strong><img alt="" src="/TMXWebsite/media/TMXWebsite/MT4-Tips-and-Tricks-Setting-Default-Chart.PNG?width=300&height=489" style="width: 300px; height: 489px; float: left; margin-top: 0px; margin-right:24px;" /><strong>Setting the default chart</strong></strong><br /> Once you have a chart you’re happy with, you can save it as a template. The quickest and easiest way to do this is by right-clicking on the chart and selecting “Template”, followed by “Save Template”. You can have as many templates as you like to match all of your trading strategies.<br /> If you have a preferred template that you wish to save as your default, you can do this by right-clicking on the chart, selecting “Template”, “Save As” and then “Default”.</p> <h2><strong style="color:#007c8c;">Customising toolbars</strong></h2> <p>Many of the toolbar functionalities can be distracting and you may find you don’t use all of them. With MT4 you can add in or hide as many features as you want.<br /> <img alt="" src="/TMXWebsite/media/TMXWebsite/MT4-Tips-and-Tricks-Moving-Tool-Bar.PNG?width=300&height=168" style="width: 300px; height: 168px; float: right;" /> There are four separate toolbars available:</p> <ul> <li>Standard</li> <li>Chart studies</li> <li>Line studies</li> <li>Time frames</li> </ul> <p> </p> <p> </p> <p><br /> You can move toolbars around by simply dragging them to wherever you’d like them to be.<br /> <br /> To customise what you view, you can simply right-click on the toolbar and click on the customise sub-menu. Here you can remove functions that aren’t required by un-ticking them.<br /> <br /> <img alt="" src="/TMXWebsite/media/TMXWebsite/MT4-Tips-and-Tricks-hidden-Tool.PNG?width=300&height=141" style="width: 300px; height: 141px; float: right;" />By using the customise feature on each toolbar, you can access hidden tools, while removing any you don’t require. Through this technique, you can end up with a much cleaner and more compact user interface.</p> <br /> <p><strong>Using shortcuts</strong><br /> Keyboard shortcuts are a quick and easy way to perform tasks. By using shortcuts, you can have faster access to tools – saving plenty of time in the long run. You can remove redundant information and functionalities, and most importantly increase your charting space.<br /> The following keyboard shortcuts can help to navigate your way around the platform easier:<br /> </p> <table border="1" cellpadding="0" cellspacing="0"> <tbody> <tr> <td style="width:113px;"> <p><strong>Terminal</strong></p> </td> <td style="width:85px;"> <p>Control+T</p> </td> <td style="width:403px;"> <p>This is the main window you use while trading – manage open orders, view account history and set alerts</p> </td> </tr> <tr> <td style="width:113px;"> <p><strong>Navigator</strong></p> </td> <td style="width:85px;"> <p>Control+N</p> </td> <td style="width:403px;"> <p>Add Indicators, Expert Advisors and log in</p> </td> </tr> <tr> <td style="width:113px;"> <p><strong>Market Watch</strong></p> </td> <td style="width:85px;"> <p>Control+M</p> </td> <td style="width:403px;"> <p>View available instruments</p> </td> </tr> <tr> <td style="width:113px;"> <p><strong>Data Window</strong></p> </td> <td style="width:85px;"> <p>Control+D</p> </td> <td style="width:403px;"> <p>View all data for the product currently in the chart window</p> </td> </tr> </tbody> </table> <p><br /> You can use the following shortcuts when analysing and trading, which can greatly improve the process speed of your trading:<br /> </p> <table border="1" cellpadding="0" cellspacing="0"> <tbody> <tr> <td style="width:75px;height:17px;"> <p><strong>+</strong></p> </td> <td style="width:192px;height:17px;"> <p>Zoom in</p> </td> </tr> <tr> <td style="width:75px;height:18px;"> <p><strong>-</strong></p> </td> <td style="width:192px;height:18px;"> <p>Zoom out</p> </td> </tr> <tr> <td style="width:75px;height:17px;"> <p>Control+F</p> </td> <td style="width:192px;height:17px;"> <p>Crosshair</p> </td> </tr> <tr> <td style="width:75px;height:18px;"> <p>Control+Drag</p> </td> <td style="width:192px;height:18px;"> <p>Copy objects</p> </td> </tr> <tr> <td style="width:75px;height:17px;"> <p>Alt+Drag</p> </td> <td style="width:192px;height:17px;"> <p>Extend objects</p> </td> </tr> <tr> <td style="width:75px;height:18px;"> <p>Alt+T</p> </td> <td style="width:192px;height:18px;"> <p>One-click trading</p> </td> </tr> <tr> <td style="width:75px;height:17px;"> <p>Hotkeys</p> </td> <td style="width:192px;height:17px;"> <p>User-defined shortcuts</p> </td> </tr> </tbody> </table> <p> <br /> These are the shortcuts for the more visual aspects of your charts:</p> <table border="1" cellpadding="0" cellspacing="0"> <tbody> <tr> <td style="width:75px;height:17px;"> <p>F8</p> </td> <td style="width:192px;height:17px;"> <p>Edit chart graphics</p> </td> </tr> <tr> <td style="width:75px;height:18px;"> <p>F9</p> </td> <td style="width:192px;height:18px;"> <p>Order panel</p> </td> </tr> <tr> <td style="width:75px;height:17px;"> <p>F11</p> </td> <td style="width:192px;height:17px;"> <p>Full screen chart</p> </td> </tr> <tr> <td style="width:75px;height:18px;"> <p>Alt+1</p> </td> <td style="width:192px;height:18px;"> <p>Bar charts</p> </td> </tr> <tr> <td style="width:75px;height:17px;"> <p>Alt+2</p> </td> <td style="width:192px;height:17px;"> <p>Candlestick charts</p> </td> </tr> <tr> <td style="width:75px;height:18px;"> <p>Alt+3</p> </td> <td style="width:192px;height:18px;"> <p>Line charts</p> </td> </tr> </tbody> </table> <p> <br /> <strong>Using hotkeys</strong><br /> <img alt="" src="/TMXWebsite/media/TMXWebsite/MT4-Tips-and-Tricks-Hot-Key.PNG?width=300&height=334" style="width: 300px; height: 334px; float: left;" /><br /> <br /> <br /> </p> <p><br /> In MT4, when you switch your chart templates, you’ll lose any current analysis on your charts. To prevent this, you can leave your price charts open and just change the indicators that you use – this is where hotkeys come into play. You can assign a hotkey to place a certain indicator on your charts, instead of needing to change the template.</p> <p>To assign a hotkey to an indicator, simply right-click on the indicator on the navigator window and select “Hotkey”.<br /> <br /> <br /> <img alt="" src="/TMXWebsite/media/TMXWebsite/MT4-Tips-and-Tricks-Favorite-Chart.PNG?width=300&height=182" style="width: 300px; height: 182px; float: right;" /><br /> <br /> <strong>Favourites indicators list</strong><br /> To streamline the number of indicators that are available to you, you can create a favourites list. Here’s how you can add indicators to your favourites list:</p> <ol> <li> <p>Open Navigator (Control+N)</p> </li> <li> <p>Open relevant tab (Indicators, Scripts etc)</p> </li> <li> <p>Hover mouse over desired favourite</p> </li> <li> <p>Right-click on your mouse</p> </li> <li> <p>Select ‘Add to favourites’</p> </li> </ol> <br /> <img alt="" src="/TMXWebsite/media/TMXWebsite/MT4-Tips-and-Tricks-Alert.PNG?width=300&height=365" style="width: 300px; height: 365px; float: right;" /> <strong>Alerts</strong> <p>Alerts allow you to keep track of important price levels being breached, and can further enhance your analysis and chart organisation. If you track multiple markets, it can become easy to lose track of the markets, especially after an important event and all the markets move their separate ways.<br /> To set up alerts, move your mouse to the area on the chart you’d like to set the alert at, right-click on the position, select ‘Trading’ and then ‘Alert’.</p>

10 Tips to Successful Trading
<p>سيوفر إجراءك لخطة قوية لنشاط التداول الخاص بك مخططًا لأنشطتك في التداول وتساعدك في تحديد أهدافك.<br /> <br /> وهذا بدوره سيساعدك على البقاء على المسار الصحيح وربما تجنب النتائج غير المرغوب فيها. يتضمن إنشاء خطة تداول الكثير من الأركان المؤثرة.<br /> <br /> تستغرق عملية إنشاء خطة تداول ناجحة بعض المجهود. في دليل التداول اليومي هذا، حددنا عشر خطوات أساسية تحتاجها كل خطة تداول.</p> <h2>1. فهم السوق<br /> قبل البدء بالتداول</h2> <p>إن الفهم القوي للسوق الذي ستتداول فيه أمر بالغ الأهمية لبناء خطة تداول جيدة. حيث أن امتلاك قاعدة معرفية قوية سيساعدك على التنقل بثقة بين الكثير من المعلومات في عالم التداول واتخاذ قرارات تداول مدروسة بشكل أفضل.<br /> <br /> بغض النظر عن الأدوات المالية التي تختارها لرحلة التداول الخاصة بك - فوركس أو مؤشرات أو سلع أو غيرهم - هناك ثلاث نقاط رئيسية يحتاج المتداول اليومي إلى التركيز عليها:<br /> </p> <ul> <li>مصطلحات السوق</li> <li>الخصائص الرئيسية للسوق</li> <li>العوامل المؤثرة على حركة الأسعار</li> </ul> <div class="text-center"><img class="w-75" src="/TMXWebsite/media/TMXWebsite/circle.jpg" /></div> <p>على سبيل المثال، في الفوركس، يتم قياس حركة الأسعار بالبيب، بينما في جميع الأسواق الأخرى، يتم قياسها بالنقاط أو الدرجات. هذه السمة الفريدة لكل سوق تتطلب منك فهم مصطلحات السوق.<br /> <br /> وتختلف أيضًا العوامل المؤثرة على حركة الأسعار في كل سوق. على سبيل المثال، يتأثر الفوركس بشكل كبير بالتقارير الاقتصادية الواردة من البلدان المالكة لعملات الزوج المتداول، في حين أن أسعار السلع تعتمد بشكل كبير على العرض والطلب. ونتيجة لذلك، سيتحرك سوق الفوركس في تقلبات كبيرة عندما يتم إصدار التقارير الاقتصادية (خاصة التقارير الواردة من الولايات المتحدة ومنطقة اليورو واليابان)، وستشهد السلع الكثير من الحركة بعد الإعلان عن نقص العرض. لتحديد فرص التداول التي تقدمها مثل هذه الأحداث، تحتاج إلى فهم واضح لما يؤثر بالضبط على كل سوق.<br /> <br /> <br /> يمكن أن تكون إرشادات التداول الموجودة على موقعنا الإلكتروني بمثابة نقطة انطلاق جيدة لتعلم أساسيات التداول للمبتدئين. اترك حسابك التجريبي مفتوحًا أثناء الاطلاع على أي معلومات جديدة، وحاول تطبيقها عمليًا كلما أمكن ذلك.</p> <h2>2. حدد ظروف السوق</h2> <p>إن تقييم ظروف السوق، باختصار، يعني تحديد إشارات تداول قوية توفر فرصًا للتداول. لتحديد ذلك، يجب أن تكون قادرًا على تحليل السوق الذي قمت باختياره.<br /> <br /> هناك طريقتان رئيسيتان للقيام بذلك – هم التحليل الأساسي والتحليل الفني. والفرق الرئيسي بين الاثنين هو نوع البيانات المستخدمة للتنبؤ بتحركات السوق المستقبلية.<br /> <br /> يعتمد التحليل الفني على تحركات الأسعار السابقة للأداة المالية، بينما يدرس التحليل الأساسي العوامل الاقتصادية والمالية التي قد تؤثر على الأسواق في المستقبل.</p> <div class="text-center"><img class="w-75" src="/TMXWebsite/media/TMXWebsite/fundamental_analyse.jpg" /></div> <p>في البداية، قد يبدو تحليل الأسواق المالية معقدًا، بل ومخيفًا. ومع ذلك، وكما هو الحال مع أي موضوع معقد، يمكنك البدء بمعرفة الأساسيات والتقدم شيئًا فشيئًا ومع مرور الوقت تستطيع فهم كيفية عمل الأسواق المالية بشكل أفضل.<br /> <br /> إذا كنت بدأت للتو في التداول اليومي للمبتدئين، فقد يكون من الأسهل البدء بالتداول وفقاً للأخبار وتحديد مستويات الدعم والمقاومة وفهم بعض أنماط الرسم البياني الأساسية. من ناحية أخرى، يمكن للمتداولين من ذوي الخبرة العثور على إشارات التداول في التقارير الاقتصادية المعقدة والمؤشرات الفنية. بغض النظر عن مستوى خبرتك، يجب أن يكون لديك فهم واضح لعملية التحليل التي تستخدمها قبل البدء في الاعتماد عليها.<br /> <br /> ومع ذلك، سواء اخترت التحليل الأساسي أو التحليل الفني أو مزيجًا من الاثنين، فمن المهم ملاحظة أن أيًا منهما لا يوفر نتيجة تداول مضمونة. يشير أي تحليل للسوق فقط إلى حركة سعرية محتملة ويمكن أن يساعد في تحديد نقطة الدخول الخاصة بك.</p> <h2>3. تعرف من أين تدخل السوق</h2> <p>في التداول، تشير نقطة الدخول إلى مستوى السعر الذي ترغب في فتح صفقة عنده. أثناء قيامك بتحليل السوق، سترى في أغلب الأوقات أن الأسواق تكون مهيأة للتداول، بينما في أوقات أخرى قد يكون من الأفضل اتخاذ موقف حيادي. إذا كانت إشارة التداول التي حددتها قوية، فيمكنك فتح صفقة على الفور. ولكن، إذا لم تكن متأكدًا من ظروف السوق الحالية أو أن المعلومات المتاحة توفر إشارات متضاربة، فقد يكون من الأفضل الإنتظار وترقب إشارة أقوى للتداول.<br /> <br /> ستكون هناك أيضًا أوقات تبدو فيها الإشارة قوية، ولكن نقطة الدخول المرغوبة ليست متاحة في السوق بعد. في هذه الحالة، يمكنك وضع أمر معلق سيتم تنفيذه فقط عندما يصل السعر إلى المستوى المحدد. يمكن أن تساعدك الأوامر المعلقة على إدارة المخاطر والتأكد من دخولك السوق وفقًا لخطتك المحددة مسبقًا.<br /> <br /> للحصول على بعض الأفكار حول نقاط الدخول كمتداول، يمكنك أيضًا متابعة أخبار السوق المنتظمة التي ينشرها خبراء التداول على موقعنا. لا يمكن التنبؤ بالأسواق المالية، وحتى الخبراء لا يمكنهم ضمان حركة الأسعار التالية. ومع ذلك، فهم يقدمون نصائح قيمة قد تساعدك على ضبط صفقاتك.</p> <div class="text-center"><img class="w-75" src="/TMXWebsite/media/TMXWebsite/laptop.jpg" /></div> <h2>4. قم بتقييم قدرتك على المخاطرة</h2> <p>يميل المتداولون الجدد إلى تجنب المخاطرة بشكل كبير وغالبًا ما يركزون بشدة على الخسائر، أو، في حالات أسوأ، يرفضون إغلاق صفقة خاسرة. يزيدون من تعرضهم للمخاطر آملين أن يتحول السوق لصالحهم. المتداولون الناجحون يدركون أن هناك مخاطر محتملة في كل صفقة.<br /> <br /> لذلك، تحديد مستوى المخاطرة المناسب قبل البدء في التداول والالتزام به هو من أهم الخطوات لتطوير استراتيجية تداول يومية ناجحة. المتداول اليومي الحذر لن يخاطر بأكثر مما يستطيع تحمل خسارته.<br /> <br /> يتوقف تحديد مقدار رأس المال الذي يمكن المخاطرة به في كل صفقة على إجمالي حجم حساب التداول ومستوى الخبرة. يستخدم الكثير من المتداولين مستوى مخاطرة يتراوح بين 1-3% كمعيار، بينما يفضل المبتدئون البدء بنسبة 1% حتى يتأقلموا مع العملية. على سبيل المثال، إذا كان رأس مال التداول 10000 دولار أمريكي، قد تقرر المخاطرة بـ 1٪ لكل صفقة، أي 100 دولار أمريكي. ومع ذلك، ينبغي أن تتناسب هذه النسبة مع قدرتك الشخصية على تحمل المخاطر واستراتيجيتك في التداول.</p> <div class="text-center"><img class="w-75" src="/TMXWebsite/media/TMXWebsite/risk-appetite_1.JPG" /></div> <p>من النادر أن يمر المرء بسلسلة متتالية من الربح أو الخسارة، ولكن سواء كان اليوم إيجابيًا أو كانت التوقعات خاطئة، يجب ألا يؤثر ذلك على مستوى المخاطرة الذي تم تحديده مسبقًا.</p> <h2>5. فهم نسبة المخاطرة إلى العائد</h2> <p>نسبة المخاطرة إلى العائد هي التوازن بين المبلغ الذي تستعد لخسارته والعائد الذي تأمل في تحقيقه. بعد تحديد مستوى المخاطرة الذي ترتاح له، يأتي اختيار مستوى العائد المطلوب. وكما هو الحال بالنسبة لمستوى المخاطرة من 1 إلى 3%، فإن نسبة المخاطرة إلى العائد 1:3 تُعد مقبولة عمومًا بين المستثمرين.<br /> <br /> هذا يعني أنه يجب ألا تتوقع أكثر من ثلاث نقاط عائد مقابل كل نقطة تخاطر بها. لذا، مع رأس مال تداول قدره 10,000 دولار أمريكي ومستوى مخاطرة قدره 1% (100 دولار أمريكي)، يجب ألا يتجاوز العائد المستهدف 300 دولار أمريكي. ومع ذلك، غالبًا ما يفضل المبتدئون البدء بمستوى عائد أقل أيضًا وتحديد نسبة المخاطرة إلى العائد الخاصة بهم إلى 1:1، وهو 100 دولار أمريكي كعائد مستهدف لكل 100 دولار أمريكي من المخاطرة.<br /> <br /> في كثير من الحالات، يعتمد هدف العائد المعقول أيضًا على الأداة المالية والسوق الذي تتداول فيه. على سبيل المثال، لا ينبغي أن تتوقع تحرك السعر بمقدار 300 نقطة من سوق متوسط تحركها 100 نقطة.</p> <div class="text-center"><img class="w-75" src="/TMXWebsite/media/TMXWebsite/risk-reward-ratio_1.JPG" /></div> <h2>6. تحكم في رأس مالك</h2> <p>إن تحركات الأسعار في أي سوق تداول هي خارجة عن سيطرتك كمتداول. ما يمكنك التحكم فيه هو التأثير السلبي أو الإيجابي لأي منها على حساب التداول الخاص بك. ستساعدك أدوات إدارة المخاطر، مثل أوامر وقف الخسارة وجني الربح، في الحفاظ على نسبة المخاطرة إلى العائد الخاصة بك تحت السيطرة وتجنب النتائج غير المرغوب فيها وغير المتوقعة.<br /> <br /> بشكل عام، كل صفقة تقوم بها لها ثلاث نتائج محتملة فقط:<br /> </p> <ul> <li>السوق يسير لصالحك = تربح</li> <li>يتحرك السوق ضدك = تخسر</li> <li>يتداول السوق بشكل جانبي = لا ربح ولا خسارة</li> </ul> <p>للتحكم في حساب التداول الخاص بك، تتوفر خصائص للاستخدام مثل جني الربح لتأمين ربحك في الصفقات الناجحة وإيقاف الخسارة للحد من خسائرك إذا تحرك السوق ضدك.<br /> <br /> باتباع مثالنا السابق، بالنسبة لحساب تداول بقيمة 10,000 دولار أمريكي مع نسبة عائد إلى مخاطرة 1:3، يمكن ضبط أمر وقف الخسارة على 100 دولار أمريكي وضبط أمر جني الربح على 300 دولار أمريكي. في حين أن العديد من منصات التداول ستقوم تلقائيًا بحساب وعرض الأرباح المحتملة و عند تحديد مستويات جني الربح وإيقاف الخسارة، من المهم للمتداولين أن يفهموا كيفية ارتباط هذه المستويات بحركة سعر الأداة المالية الذي يتداولونها.<br /> <br /> كما ذكرنا سابقًا، يعد اتباع مستوى المخاطرة المحدد مسبقًا دون تغييره بالنسبة للصفقات الجارية بالفعل أمرًا بالغ الأهمية. لقد ارتكب العديد من المتداولين خطأ مؤسفًا يتمثل في تعديل أوامر وقف الخسارة إلى مستويات أدنى وأقل في صفقة خاسرة حتى يصلوا إلى نقطة خسارة رأس المال. في حين أن المتداولين الآخرين قاموا بتعديل أوامر أخذ الربح إلى أعلى وأعلى فقط لرؤية أرباحهم تختفي مع انعكاس الصفقة بشكل مفاجئ وسريع ضدهم.<br /> <br /> في بعض الأحيان ستجد نفسك في سيناريو ثالث، حيث تتحرك الأداة المالية التي تتداول عليها بشكل جانبي لفترة ممتدة دون تحقيق المكاسب المرغوبة ودون تفعيل وقف الخسارة. في مثل هذه الحالات، غالبا ما يفضل المتداولون الخروج من هذه الصفقة بشكل يدوي، وإعادة تقييم خطة التداول الخاصة بهم وانتظار إشارة تداول أقوى.</p> <h2>7. مراجعة خطة التداول الخاصة بك</h2> <p>إن أسهل طريقة لإعادة تقييم خطة التداول اليومية الخاصة بك هي الاطلاع على كل خطوة منها والتحقق مما إذا كانت المعلومات التي حددتها مسبقًا لا تزال صالحة وذات جدوى. ولهذا السبب فإن مراجعتها أمر ضروري.<br /> <br /> فيما يلي بعض الأمثلة على الخطوات التي يمكن تضمينها في أي خطة تداول:</p> <ul> <li>مراجعة جلسة التداول السابقة</li> <li>تحليل فرص التداول الحالية</li> <li>التحليل الكلي للسوق في الوقت الحالي – الأخبار والتقارير الاقتصادية والعوامل الأخرى التي تؤثر على الأسواق</li> <li>التحليل الجزئي للسوق الحالي – مراجعة الرسوم البيانية والمؤشرات الفنية</li> <li>نقطة دخول محددة</li> <li>مخاطرة محددة تشعر بالارتياح تجاهها لكل صفقة</li> <li>تحديد مستويات وقف الخسارة وجني الربح</li> </ul> <p><br /> كل خطة تداول فريدة من نوعها وتعتمد على الهدف الشخصي للمتداول. يمكنك اتباع نفس الخطوات أو إنشاء خطوات مختلفة لتتناسب مع احتياجاتك في التداول - بغض النظر عن الخيار الذي تختاره، فإن مراجعته قد يساعدك على البقاء على المسار الصحيح.</p> <div class="text-center"><img class="w-75" src="/TMXWebsite/media/TMXWebsite/checklist_1.jpg" /></div> <h2>8. ضع خطتك تحت الاختبار</h2> <p>إن تنفيذ خطوات خطة التداول الخاصة بك لا يقل أهمية عن مراجعتها باستمرار. استخدم حسابًا تجريبيًا لمنصة التداول الخاصة بك لاختبارها في بيئة تحاكي السوق الواقعية دون أي مخاطر.<br /> <br /> إن بذل جهد للتدريب على التداول على حساب تجريبي يمكن أن يساعد في تحديد نقاط الضعف في خطة التداول الخاصة بك ويسمح لك بتعديلها عند الضرورة. لإعطاء خطة التداول الخاصة بك اختبارًا حقيقيًا، ضع في اعتبارك أنه عند التداول باستخدام حساب تجريبي، من المهم اتباع خطتك وتنفيذ كل خطوة كما لو كنت تتداول في بيئة حقيقية.<br /> <br /> وهذا يعني عدم فتح أو غلق الصفقات إلا إذا أشارت خطتك إلى ذلك، واحترام جميع مستويات وقف الخسارة وجني الربح وإجراء التعديلات أو تصحيحات المسار فقط بعد نهاية يوم التداول، وليس خلاله.<br /> <br /> يرتكب العديد من المتداولين المبتدئين خطأ عدم التعامل مع حسابهم التجريبي بنفس الانضباط والعقلية التي يتعاملون بها مع حسابهم الحقيقي بأموال حقيقية. ونتيجة لذلك، عندما يتم تطبيق نفس استراتيجية التداول على حساب تداول حقيقي، فإن النتائج ستختلف بشكل كبير مقارنة بالحساب التجريبي. علاوة على ذلك، فإن عدم اتباع الإجراءات المحددة مسبقًا سيجعل من الصعب مراجعة جلسة التداول الخاصة بك وتحليلها لاحقًا.<br /> <br /> ولهذا السبب من المهم الالتزام بخطة التداول الخاصة بك لإعداد نفسك للانتقال من الحساب التجريبي إلى الحساب الحقيقي.</p> <h2>9. إزالة المشاعر من المعادلة</h2> <p>تعد المشاعر غير المنضبطة أحد الأسباب الرئيسية التي تجعل المتداولين يتخلون عن خطة التداول الخاصة بهم ويفشلون في تحقيق النتيجة التي يسعون إليها.<br /> <br /> عندما تبدأ بالتداول، من المهم إزالة أي تأثيرات غير مرتبطة بالتداول للسماح لنفسك بالتداول بتركيز واضح والحصول على تجربة تداول أفضل.<br /> <br /> يطبق المتداولون ذوي الخبرة تقنيات مختلفة للتخلص من الانفعالات الناتجة عن التداول اليومي واتباع الهيكل والانضباط الذي توفره خطة تداول مدروسة جيدًا. ويستخدم بعضهم طقوسًا يومية، مثل قائمة مرجعية قصيرة تتعلق بخطة التداول الخاصة بهم. ويستخدم آخرون تمرينًا بدنيًا قصيرًا للمساعدة في تصفية ذهنهم وزيادة تركيزهم. يمكن أن يكون أي شيء آخر يناسبك شخصيًا طالما أنه يساعد على تحقيق الهدف الرئيسي – تطوير عملية تساعدك على تنفيذ كل خطوة من خطوات خطة التداول الخاصة بك دون انحراف. مثل أي مهارة جديدة تتعلمها، فإن عملية التداول الخاصة بك سوف تتطور قريبًا وتصبح أمر طبيعي وبديهي طالما تسير على خطواتها.</p> <div class="text-center"><img class="w-75" src="/TMXWebsite/media/TMXWebsite/emotions.jpg" /></div> <h2>10. اكتشف من أى نوع من المتداولين أنت</h2> <p>بمجرد العمل باستراتيجية التداول الخاصة بك عدة مرات، ستبدأ في ملاحظة أن بعض الصفقات تعمل بشكل أفضل بالنسبة لك من غيرها. وذلك عندما تعلم أن الوقت قد حان لاكتشاف شخصيتك في التداول.<br /> إن فهم شخصيتك في التداول يمكن أن يساعدك على تحقيق تجربة ونتائج أكثر إيجابية من تداولك. يكون بعض المتداولين منسجمين أكثر في فتح صفقات قصيرة الأجل بأحجام تداول كبيرة، بينما يفضل البعض الآخر استخدام أسلوب أبطأ على المدى الطويل.<br /> <br /> إن تحديد أسلوب التداول الذي يناسبك لا يقل أهمية عن معرفة شخصية السوق الذي تقرر التداول فيه. هناك العديد من التقييمات المتاحة عبر الإنترنت لمساعدتك على معرفة المزيد عن نفسك في بيئة التداول، بالإضافة إلى العديد من الكتب والمقالات المكتوبة عن علم نفس التداول والسلوكيات في الأمور المالية. اكتشف من أنت كفرد وكيف يمكن أن يطبق ذلك على سيكولوجية واستراتيجيات التداول الخاصة بك.</p> <div class="text-center"><img class="w-75" src="/TMXWebsite/media/TMXWebsite/human_1.JPG" /></div> <h2>إضافة: 11. تطبيق الانضباط والثبات</h2> <p>لا يوجد طريق مثالي ومطلق للنجاح في التداول، ولكن كما هو الحال مع العديد من الأمور في الحياة، يمكن اعتبار الانضباط والثبات أمرًا أساسيًا. قد يستغرق الأمر أكثر من محاولة وبعض الصبر لمعرفة ما إذا كانت استراتيجية معينة ناجحة أم لا.<br /> <br /> غالبًا ما يتخلى المتداولون المبتدئون عن خططهم بمجرد مواجهة خسارتهم الأولى وينتقلون إلى استراتيجية أخرى على أمل أن تعمل بشكل أفضل. كن منضبطًا وثابتاً، وادرس المعلومات حول جلسات التداول الخاصة بك وخطط لخطواتك التالية فقط مع الفهم بشكل واضح لما ينجح وما لا ينجح.<br /> <br /> هل مستعد لبدء التداول اليومي ؟ ابدأ مع ThinkTrader. تتيح منصتنا الحائزة على جوائز إمكانية تداول أكثر من 4,000 أداة مالية بجانب أنها توفر أخبار عن السوق وأدوات للتحليل متعددة لمساعدتك في تحديد خطة التداول الخاصة بك.<br /> <br /> قم بتجربة المنصة الآن على <a href="http://web.thinktrader.com/account/login" target="_blank">متصفح الويب</a> أو قم بتنزيل التطبيق [رمز الاستجابة السريعة].<br /> </p> <p style="text-align: center;"><img alt="" class="w-25" src="~/getmedia/e1074687-a223-4ed5-a7a2-540d16d4b2cd/QR-code_1.png?width=200&height=200" style="width: 200px; height: 200px;" /></p> <p style="text-align: center;"><a class="button large hollow secondary" data-di-id="di-id-89b33f44-3ddfd855" href="/TMXWebsite/media/TMXWebsite/10-tips-to-successful-trading-pdf.pdf" onclick="DownloadFn()">قم بتنزيل نسخة pdf</a></p> <p> </p>
Trading styles
<h3>Trading styles</h3> <p>Here we will discuss the trading styles you are likely to come across. What typically separates the trading styles is the length of time you intend to be in a trade, the timing of your entry and in some cases, the frequency of the trades.</p> <p>There are no strict rules as to which timeframes a particular trader would use to trade, however the table below provides typical timeframes you would expect to see a trader using.</p> <div class="smallmargin-bottom"><img alt="Trading styles" src="/TMXWebsite/media/TMXWebsite/trading_styles_1.png" /></div> <div class="text-center smallmargin-bottom"><img alt="Trading styles" src="/TMXWebsite/media/TMXWebsite/trading_styles_2.png" /></div> <h3>EOD (End of Day)</h3> <div class="smallmargin-bottom"><img alt="Trading styles" src="/TMXWebsite/media/TMXWebsite/trading_styles_3.png" /></div> <p>This is a popular trading style for anyone who works full time. They may analyse the markets on a daily or weekly basis and set pending orders to catch price moves as they evolve – they will not be watching the screens when their orders trigger.</p> <p>If you have a busy lifestyle this may be a suitable method because it requires less time in front of the screen to analyse or manage the trade.</p> <h3>Fundamental (Macro Trading)</h3> <div class="smallmargin-bottom"><img alt="Trading styles" src="/TMXWebsite/media/TMXWebsite/trading_styles_3-(1).png" /></div> <p>Using Fundamental information and/or financial models to assess the strength or weakness of a stock, currency, market, or country to anticipate future price value. The source of information would vary between stocks and forex as they are are also affected by internal news of a particular company, as well as macro information.</p> <h3>Intraday trading</h3> <div class="smallmargin-bottom"><img alt="Trading styles" src="/TMXWebsite/media/TMXWebsite/trading_styles_4.png" /></div> <p>An intraday trader opens and closes a trade within the same day. Swing trading the 1HR chart could be included as Day Trading, and day-trading has a lot more emphasis on Technicals over fundamentals.</p> <p>There are also different forms of intraday trading which are covered in detail below, including: Scalping; News Trading; Swing Trading; Trend Trading.</p> <h3>News trading</h3> <div class="smallmargin-bottom"><img alt="Trading styles" src="/TMXWebsite/media/TMXWebsite/trading_styles_5.png" /></div> <p>News traders tend to specialise in ‘Red News’ events and trade during, or around the release of an important news release. Extreme volatility can occur if a surprise figure is released (which is not widely anticipated by the markets) which creates opportunity to make more profit over a very short period of time. However, longer-term moves may also unfold after an important event which may get the interest of macro traders to trade on the longer term trend, however news trading typically relates to short-term events.</p> <h3>Position trading</h3> <div class="smallmargin-bottom"><img alt="Trading styles" src="/TMXWebsite/media/TMXWebsite/trading_styles_3-(2).png " /></div> <p>A type of trader who holds a position for the long term (from weeks, to months to years). Long-term traders are not concerned with short-term fluctuations because they believe that their long-term investment horizons will smooth these out.</p> <p>Position traders tend to use a lot more fundamental information due to the longer holding time of the trade, yet they may also be purely technical. Position traders and swing traders are more likely to use pending orders to enter the market, as they don’t need to be at the screen when their trade enters or exits.</p> <h3>Scalping</h3> <div class="smallmargin-bottom"><img alt="Trading styles" src="/TMXWebsite/media/TMXWebsite/trading_styles_6.png" /></div> <p>Scalping is a form of intraday trading, and unlike the other styles, you must stay glued to your screen as if your life depends on it.</p> <p>Whilst it is an extremely popular form of trading due to the higher potential for profits, it is also one of the harder styles to master as it requires a lot more discipline from the trader. Despite this last point, scalping typically attracts the most interest from newer traders.</p> <p>Intraday and scalpers will use 1-click trading to enter the market live because a quick entry is very important to them.</p> <h3>Swing trading</h3> <div class="smallmargin-bottom"><img alt="Trading styles" src="/TMXWebsite/media/TMXWebsite/trading_styles_7.png" /></div> <p>As a swing trader you are literally trying to trade the swing of a chart and hope to catch a big move. Popular timeframes are to enter on the daily chart, and hold a position for days, or sometimes weeks. However, the 1 hour charts are also very popular with a view to hold a position for a few hours, or maybe overnight and potentially for a few days.</p> <h3>Technical trading</h3> <div class="smallmargin-bottom"><img alt="Trading styles" src="/TMXWebsite/media/TMXWebsite/trading_styles_8.png" /></div> <p>Analyse, enter, manage and exit their trading using technical analysis. This can be performed on any timeframe, although generally speaking ‘technicals’ are more popular on intraday timeframes, however technical analysis can also be used for long-term forecasting.</p> <h3>Trend trading</h3> <div class="smallmargin-bottom"><img alt="Trading styles" src="/TMXWebsite/media/TMXWebsite/trading_styles_9.png" /></div> <p>The object here is to identify a trend and only trade in the same direction as the suspected trend. Traditionally trends traders were associated with long-term fund managers, however in reality you can become a trend trader on any timeframe you choose as all timeframes trend.</p>
How to start trading the markets
<h2 id="how-to-start-heading-unique-id-1">Step 1 – Apply for an account with us</h2> We offer a wide range of financial instruments to trade across two of the industry’s leading platforms: MetaTrader 4 (MT4) and our very own ThinkTrader®. Simply apply for an account and provide us with the requested documentation and once approved, we’ll provide you with your login details to access your trading account for the very first time.<br /> <br /> <a href="https://portal.thinkmarkets.com/account/register/live?lang=en" id="button-one">Apply today</a><br /> <h2 id="how-to-start-heading-unique-id-2">Step 2 – Time to fund</h2> Once your account is opened you’ll be able to fund it and place your first trade. Funding your account is simple with our online client portal, ThinkPortal. In ThinkPortal you’ll have access to a wide list of funding options, from credit/debit card and bank wires to local payment providers and digital wallet services. The funds will usually be in your account within 12 hours and you’ll be ready to place your first trade.<br /> <br /> <a href="https://portal.thinkmarkets.com/" id="button-two">Fund your account</a><br /> <h2>Step 3 – Let’s get trading</h2> <p>Now that your account is open and funded, you can take that final step and open your first position. Here are a few pointers to help you get started:<br /> </p> <p>Remember – never place a trade that you’re not sure about. Your investment is at risk with every trade you place, so make sure you’re fully behind the decision of placing the trade before hitting the button.<br /> </p> <p> </p> <ol> <li> <p>Understand the markets – ensure you know what you want to trade and when to trade it. Our market analysis section provides plenty of market insight on a daily basis and becoming familiar with our analysts and their articles can be a helpful place to keep track of market news and trading opportunities.</p> </li> <li> <p>Know the platform – before opening your first trade we highly recommend that you become familiar with the platform of your choice. Explore the different platform features and ensure you’re comfortable with the settings before opening the order ticket for the first time. Read about our ThinkTrader® and MetaTrader 4 (MT4) platforms <a href="/en/platformoverview/">here</a></p> </li> <li> <p>Place your trade – once you’re comfortable within the platform, identify the trade you want to make and how you plan to execute it, open the order ticket, set your parameters and place the trade.</p> </li> </ol>
Traders’ Gym 101: How to use ThinkMarkets’ exclusive backtesting tool
<p paraeid="{7c90bd47-7d9d-45e3-adca-ddf4dd5c5c68}{192}" paraid="684400438">If you could go back in the past, what would you do differently? <br /> </p> <p paraeid="{7c90bd47-7d9d-45e3-adca-ddf4dd5c5c68}{208}" paraid="957565690">In the world of trading, split-second decisions can result in thousands of dollars of profit or loss. It is not uncommon to hear stories of distressed traders missing a golden opportunity because of hesitation or, worse, lamenting about a bad trade that lost them a huge amount of money. <br /> </p> <p paraeid="{7c90bd47-7d9d-45e3-adca-ddf4dd5c5c68}{226}" paraid="1861411546">When the markets are highly volatile, having a robust, tried and tested trading strategy is doubly important. With a game plan in mind, traders avoid making huge mistakes, such as impulsive trades brought upon by emotions or FOMO. <br /> <br /> So, how do you build a trading strategy that you think could work? With backtesting, of course! <br /> </p> <p paraeid="{39090e05-068c-41e7-9cf0-595c1a4b6e3f}{13}" paraid="2026032670">Introducing Traders' Gym, ThinkMarkets' exclusive backtesting tool. By using Traders' Gym, traders can access real-life historical data and test their trading strategies to determine how they would have fared at that particular time. </p> <h3 aria-level="2" paraeid="{39090e05-068c-41e7-9cf0-595c1a4b6e3f}{31}" paraid="26210393" role="heading">What is backtesting? </h3> <p paraeid="{39090e05-068c-41e7-9cf0-595c1a4b6e3f}{43}" paraid="851200962">Backtesting is a data-driven process to evaluate the performance and efficiency of a trading strategy using historical market data. With a backtesting tool, traders can assess how a plan would have performed had they opened a position at the time. </p> <h3 aria-level="2" paraeid="{39090e05-068c-41e7-9cf0-595c1a4b6e3f}{49}" paraid="1706898775" role="heading">What is Traders' Gym? </h3> <p paraeid="{39090e05-068c-41e7-9cf0-595c1a4b6e3f}{57}" paraid="1532789690">Traders' Gym is ThinkMarkets' backtesting tool, available exclusively on ThinkTrader, its proprietary and award-winning trading platform. </p> <p paraeid="{39090e05-068c-41e7-9cf0-595c1a4b6e3f}{63}" paraid="346267293">Accessible to all ThinkTrader live account holders, Traders' Gym allows traders to enter a simulated market and choose a specific timeframe for testing. It offers a unique opportunity to gain valuable insights into a strategy's effectiveness and how to improve decision-making. </p> <h3 aria-level="2" paraeid="{39090e05-068c-41e7-9cf0-595c1a4b6e3f}{69}" paraid="1623950747" role="heading">How to use Traders' Gym? </h3> <p paraeid="{39090e05-068c-41e7-9cf0-595c1a4b6e3f}{77}" paraid="1416734207">We created a beginner-friendly video on how you can develop and test your trading strategy using Traders' Gym here. <br /> <br /> <a href="https://www.youtube.com/watch?v=kJ7pQM8g_EE" rel="noreferrer noopener" target="_blank">Traders' Gym: Develop and Test Your Trading Strategy</a> <br /> </p> <iframe allow="accelerometer; autoplay; clipboard-write; encrypted-media; gyroscope; picture-in-picture" allowfullscreen="" data-gtm-yt-inspected-12805312_132="true" data-gtm-yt-inspected-6="true" data-gtm-yt-inspected-9="true" frameborder="0" height="315" id="614567584" src="https://www.youtube.com/embed/kJ7pQM8g_EE?si=Hy7XMCrzS5RB9AAQ enablejsapi=1&origin=https%3A%2F%2Fwww.thinkmarkets.com" title="Live Market Analysis Webinar: 7 September 2021" width="566"></iframe> <h3 aria-level="2" paraeid="{39090e05-068c-41e7-9cf0-595c1a4b6e3f}{96}" paraid="1449664235" role="heading"><br /> Benefits of backtesting </h3> <p paraeid="{39090e05-068c-41e7-9cf0-595c1a4b6e3f}{106}" paraid="1853098259">Here's why you should include backtesting when you're building your trading strategy. <br /> </p> <ul> <li aria-level="3" paraeid="{39090e05-068c-41e7-9cf0-595c1a4b6e3f}{112}" paraid="1912719269" role="heading"><strong>Validate your strategy</strong></li> </ul> <p paraeid="{39090e05-068c-41e7-9cf0-595c1a4b6e3f}{120}" paraid="57901308">Gain an extra layer of confidence in your trading strategy by identifying whether it would have been profitable in the past. <br /> </p> <ul> <li aria-level="3" paraeid="{39090e05-068c-41e7-9cf0-595c1a4b6e3f}{126}" paraid="286902670" role="heading"><strong>Manage your risk </strong></li> </ul> <p paraeid="{39090e05-068c-41e7-9cf0-595c1a4b6e3f}{134}" paraid="537820592">Understand the potential risks associated with your strategies, including drawdowns, maximum losses, and the risk of such events. Adjust your take profit and stop loss depending on your risk tolerance. <br /> </p> <ul> <li aria-level="3" paraeid="{39090e05-068c-41e7-9cf0-595c1a4b6e3f}{140}" paraid="1952016635" role="heading"><strong>Enhance your skills risk-free </strong></li> </ul> <p paraeid="{39090e05-068c-41e7-9cf0-595c1a4b6e3f}{148}" paraid="673426426">Train your skills and execute your strategies under actual market conditions without the risk of losing money. As it is historical data, try multiple strategies using the same timeframe. </p> <h3 aria-level="2" paraeid="{39090e05-068c-41e7-9cf0-595c1a4b6e3f}{154}" paraid="1775050610" role="heading">Sign up for an account </h3> <p paraeid="{39090e05-068c-41e7-9cf0-595c1a4b6e3f}{162}" paraid="1549691577">Traders' Gym is free for all live ThinkTrader account holders. <a href="https://portal.thinkmarkets.com/account/individual" target="_blank">Open an account today</a> and start testing your strategies under real historical data. </p> <p paraeid="{39090e05-068c-41e7-9cf0-595c1a4b6e3f}{168}" paraid="429489726">Step into the future of trading with ThinkTrader and use the past as a learning experience. <br /> </p> <p paraeid="{39090e05-068c-41e7-9cf0-595c1a4b6e3f}{184}" paraid="496255478">Please note that past performance does not guarantee future returns. </p>
Ready to trade?
Ready to start your trading journey with ThinkMarkets? Apply for an account in just a matter of minutes.


