What is a bear market?
A bear market is considered to be a decline of 20% or greater from a particular index’s all-time high. For example, the last all-time high for the S&P ASX200 occurred on Friday 13 August 2021 at 7632.8. Not kidding, Friday the 13th, and yes, there’s been a great deal of bad luck for local investors since then. The lowest price since that peak was set on 20 Jun at 6407 – or some 16% lower, i.e., not yet a bear market.
Compare this to the Nasdaq Composite (COMP). It peaked at 16212.2 on 22 November 2021 and its worst point occurred on 16 Jun this year when it plumbed 10565.1 – a loss of 34.8%. A bona fide bear market! The 16 Jun low will continue to stand as the current bear market’s low until it is breached. If it is not breached, 10565.1 will go down in history as the starting point of the next bull market. That bull market will officially begin when the COMP next trades above 16212.2.
.png.aspx?width=700&height=394)
Looking at the COMP chart above, we can see that within the current bear market there have been a number of rallies. The most notable occurred between 14 and 29 March where the COMP rallied an impressive 16.7% from low-to-high in just 11 trading sessions. As you can see, bear market rallies can be very convincing indeed! In fact, the COMP’s 14-29 March performance was the 15th largest on record. FYI, a staggering nine of the historical bear market rallies which were bigger, occurred within the 2000-2002 ‘Dot-com Crash’ bear market alone.
How does the current Nasdaq bear market compare?
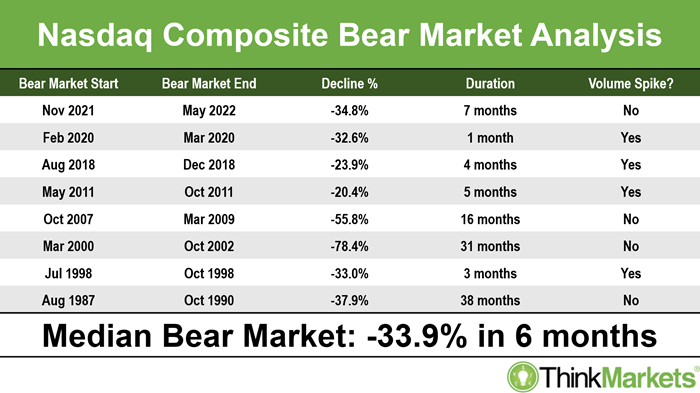
This is a nice segue into how the current COMP bear market compares to others through history. Investors who believe history is anything to go by, should note a typical COMP bear market lasts for around 6 months and results in a decline of roughly 34%. The stats on bull markets are plus 86% in 33 months. So, if there’s a silver lining with bear markets, it’s that they’re usually short and sharp – like ripping off a band aid!
Having said this, the Dot-com bear market's devastating 78.4% decline over a withering 31 months is a stark reminder of how cruel bear markets can be. Even crueller, as mentioned earlier, there were nine massive attempts to break out of it, with logically, eight failing. Clearly, there's great value in having a reliable methodology for spotting which bear market rallies are most likely to succeed.
It’s also worth noting the current COMP bear is very close indeed to typical, both in terms of price and time. However, it's concerning it's now running over time. The combination of this, and the fact that like other longer bear markets it is also to yet deliver a substantial volume spike, suggests the current bear
could end up playing out like those more protracted affairs. I’ll explain the significance of the Volume Spike column later.
How to spot if a bear market rally has legs
Back to bear market rallies and how to spot if the bull market low is in. Clearly, bear markets present investors with one of the most dangerous dummy-head-fakes in markets. You don’t want to dip that toe in the water too early, ask that chap on
Sunrise a few weeks ago who thought it was a good idea to swim in a water hole full of crocs. So, let’s run through how to tell if a bear market rally has legs, or if it’s likely to fail like so many others have done before.
As you might expect me to say, it all starts with the candles! We want to see some hefty demand-side examples at the low point of the recent rally. Demand-side candles are the large white ones, and or the ones with long lower shadows. Demand-side candles indicate in the short-term supply has dried up and buyers are returning to the market. The more demand-side candles, the better.
Ideally, we next see the price action (i.e., the relative position of peaks and troughs) switch back to higher peaks and higher troughs – which I refer to as ‘good price action’. This is probably the most important thing I’ll say today, so listen up:
Bear markets are all about sell the rally, that is, take any chance to bail out at better (higher) prices because you think you might not get another…and
Bull markets are all about buy the dip, that is, take any chance to pile in at better (lower) prices because you think you might not get another… So, higher peaks and troughs indicates investors have moved back to buy the dip. Don’t trust a potential market bottom until you see higher peaks and higher troughs!
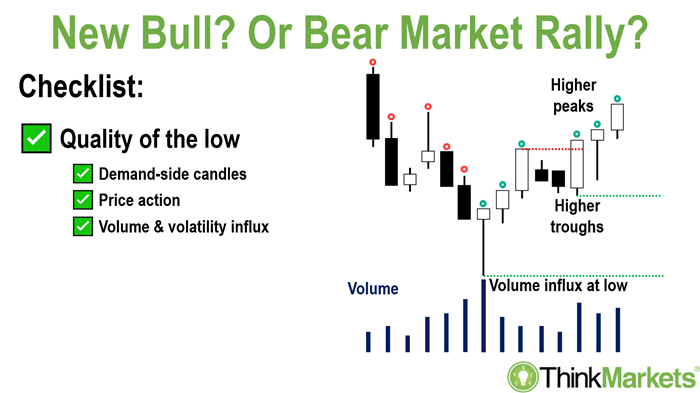
The final piece of the puzzle for Step 1, is an influx of volume and volatility. This is where the last column of the Nasdaq Composite Bear Market Analysis table comes in. To be really sure you’ve seen a meaningful bear market low, you should observe significantly (i.e., roughly double) volume and volatility at or near the low point. This indicates the last hangers-on have capitulated and dumped their stock. We know that many of them did it, refer to the high volume, and because of those demand-side candles, we also know some strong hands gleefully snapped up all that discounted stock.
In each of the previous ‘short’ bear markets (i.e., less than 6 months in duration), the bear market low coincided with a significant influx in volume. The longer the bear market, however, the less likely this key indicator occurred. My fear is that the current bear market is starting to creep into the ‘long’ variety, and it hasn’t yet delivered a convincing volume signal. (da-da-daaahhhmmm!)
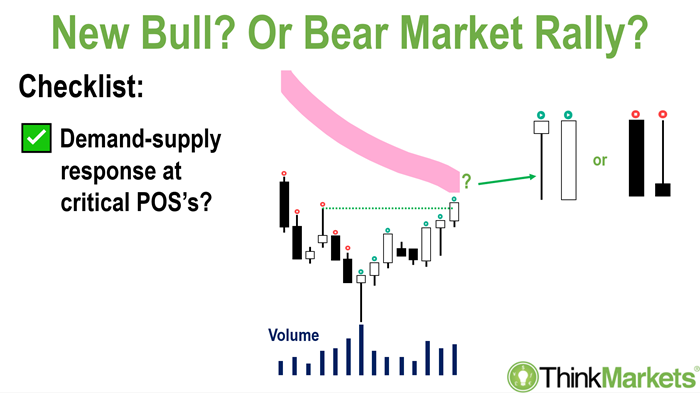
The next key indicator your bear market rally has legs, is how it behaves at my short- and long-term trend ribbons. You’ll notice from the current COMP chart (the first chart above) my ribbons do a very good job of pushing prices back down in a bear market phase. As in, tick them off...the rally to 13711 ☠, the rally to 12986 ☠, the rally to 12320 ☠, and the most recent rally to 11678 ☠.
So, it's pretty simple here, if we hit those ribbons with a bunch of supply-side candles (remember, they’re the large black ones and or have long upper shadows), it means we’re probably still in sell the rally mode – therefore brace for further falls.
On the other hand, if we see those ribbons hit with a bunch of demand-side candles the rally stands a real chance of getting to Step 3, which is the eventual transitioning of those ribbons back to uptrends. On my charts, this means you’ll see the ribbons turn back to green. Just as important here, you should also find the ribbons go from pushing down prices as they did in the bear market, to supporting prices, which is what they tend to do in a bull market.
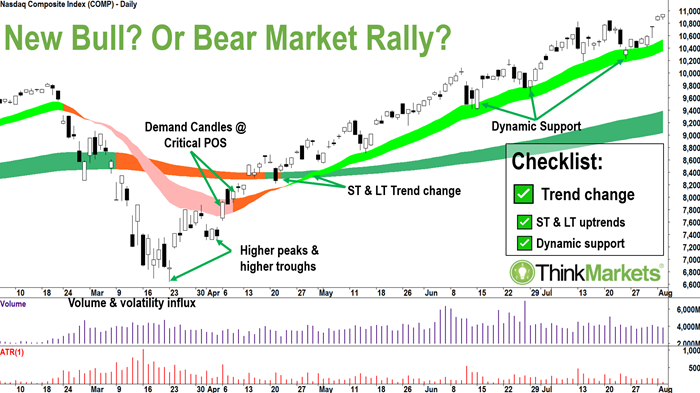
The chart above shows how the COMP emerged from the 2020 COVID-19 bear market. It’s kind of a text-book example of all the ingredients required for a successful bear market rally. Compare to today’s COMP chart (you’ll have to do a bit of scroll up and scroll back down again, sorry!) and we can see just how well-established the current short- and long-term trends are to the downside. The batch of candles between 17 Jun and 24 Jun in the current rally qualify as strong demand-side candles. Great, first check in the check list, but that’s about as far as we get in checking boxes for this attempt being a successful bear market rally. (
cue da-da-daaahhhmmm sound effect again!)
So far, we’re yet to see higher peaks and higher troughs in the price action, and we are sorely lacking that volume influx which signals sellers have capitulated and the big money has swooped back in. Some good news: we’ve reached the short-term downtrend ribbon. Some bad news: last night’s candle signals there’s some hefty supply here. A few more supply-side candles in and around the ribbon and there’s every chance we’ll slip back into the downtrend. Finally, those ribbons don’t look like turning green any time soon. Hmmm. Not good.
So, you can see there’s a few key technical signals which need to go right for the COMP before it signals it is indeed emerging from the current bear market. These signals could play out over the next few weeks, and possibly even months, as we carefully put each piece of the puzzle together. The signs so far don’t look great for a sustainable rally, but you never know, there’s another candle coming tomorrow – it can the outlook. In any case, at least you’ll know what to look for to determine if the new bull market has indeed begun!
Want your portfolio questions answered? Register for next week's Ask the Experts and attend live! You can ask Carl about any stock you're interested in.