 ES
ES
Articles (11)
Trendlines in technical analysis: support and resistance explained
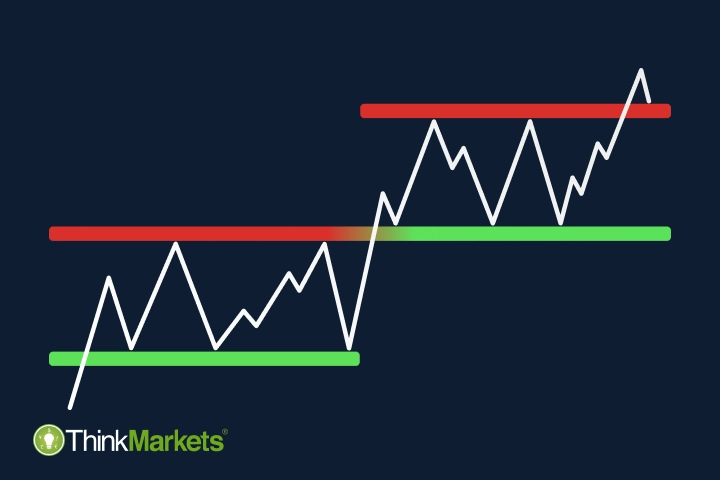
<p>Identifying trends is often a starting point of the technical analysis journey for many beginners, as it's the most beginner-friendly way to find trading opportunities.<br /> <br /> In this article, we'll explain what trendlines are, how support and resistance work and how to spot potential entry points in a market.</p> <h2>What are trendlines?</h2> <p>A trendline is a line connecting two or more price points in a chart. Traders draw this line with the help of various drawing tools offered by almost every trading platform.<br /> <br /> For example, here is a wide selection of drawing tools on ThinkTrader, ThinkMarkets' proprietary trading platform.<br /> <br /> <img alt="Drawing tools on ThinkTrader" src="~/getmedia/d039a5ad-8318-4690-b5c8-01063a5ee1e0/Drawing-tools-on-ThinkTrader.png" /></p> <h2>Support and resistance</h2> <p>Trend lines are used to identify the trend direction of an instrument, and to indicate potential support and resistance.<br /> <br /> Both support and resistance represent levels where a price bounces back and starts moving in the opposite direction.<br /> <br /> <img alt="Support and resistance levels" src="~/getmedia/68c1b4f5-a387-4380-ad1b-d8326d955bd7/Support-and-resistance-levels.png" /><br /> <br /> As you can see in the image, resistance is located on top of the price channel. It is called so because that's where the rising price meets resistance and slows down. On the other hand, the support level is located at the bottom of the price channel that's where the falling price is supported and slowed down.</p> <h2>How do support and resistance work?</h2> <p>Price movements and direction depend on market psychology and how many bullish and bearish traders are active on the market at any given time.<br /> <br /> When the market has more buyers than sellers and subsequently more buy positions than sell positions, it pushes the price higher toward the resistance level. As it approaches the level, traders that bought at lower levels will realise that the price reversed lower from the same price in the past and take the opportunity to lock-in profits. As there are more sellers than buyers at the resistance level, the price will reverse again, and reach a new resistance level.<br /> <br /> There is no set timeframe for identifying the previous price reversal level. It could have happened a few days, weeks or months ago. It is important to note that the more often the price bounced off to the same level in the past, the higher the chances it will happen again. The older the resistance level, the more important it becomes.<br /> <br /> If bullish traders overpower bearish, which means more people buying (going long) than selling (going short), the price rises and breaks through the resistance level. This breakthrough is usually caused by some external news on the market, such as a new monetary policy announcement, that can be identified with the help of fundamental analysis.<br /> <br /> Once the breakout happens, the role of support/resistance usually flips – resistance becomes support, and if the breakout happens in a downward movement, support becomes resistance.<br /> <br /> <img alt="Resistance level reversed into support level" src="~/getmedia/85ee2f59-6c3f-45f2-9598-0ef19d15f71b/Resistance-level-reversed-into-support-level.png" /></p> <h2>How to find support and resistance levels</h2> <p>Both support and resistance can be very helpful tools to identify a potential trading opportunity because once a breakout occurs, it may indicate a potential entry point for a position in the same direction.<br /> <br /> To identify and draw support and resistance in a chart, you need to find and connect the highs and the lows (also called peaks and troughs) of the same price level. You don’t necessarily need to look for both levels simultaneously – even one of them can be quite insightful.<br /> <br /> For example, on the image below, you can see how we identified a level that was both support and resistance during different periods of time.<br /> <br /> <img alt="A valid trend line as both support and resistance." src="~/getmedia/3cb82df4-4120-4601-b438-5916187ef0c1/A-valid-trend-line-as-both-support-and-resistance.png" /><br /> <br /> One more factor to pay attention to is that when the price approaches the support/resistance level or even when it breaks through, it can trigger a lot of hesitation on the market with an equal number of bullish and bearish activities creating sideways price movement.<br /> <br /> Once you find such a movement, you can add an additional support or resistance level there that will serve as an extra suggestion for a trading opportunity.<br /> <br /> For example, on the image below, you see the same <a href="~/en/eur-usd">EUR/USD</a> chart with support and resistance levels and an additional support level:<br /> <br /> <img alt="Additional support level in a price chart" src="~/getmedia/2ebfa33c-4579-4b03-9c80-f648f967225c/Additional-support-level-in-a-price-chart.png" /><br /> <br /> Once you are comfortable with drawing support and resistance, you can step up your technical analysis and try to identify trends.</p> <h2>What are trends in trading?</h2> <p>A trend in trading, just like in any other aspect of life, means a general direction of movement or development. When experienced traders talk about trends and trend trading, they imply the direction of price movements of an instrument.<br /> <br /> All trends are formed by a succession of highs and lows. To identify one, you need to connect these highs and lows in the same manner you did, drawing support and resistance.<br /> <br /> For example, on the image below, we connected the highs of a certain part of the chart with one trendline and the lows with another one. Such formation is called a channel, and the two trendlines essentially serve as support (the lower one) and resistance (the higher one).<br /> <br /> <img alt="How to draw trend lines in a price chart" src="~/getmedia/9a9c2e1a-521c-41cc-a3fa-d4599e5bcb5e/How-to-draw-trend-lines-in-a-price-chart.png" /><br /> <br /> As you can see, the resistance line doesn’t connect all the available highs, as one of them goes through the line. Keep this thought; we’ll explain what it means further in the article.</p> <h2>Bullish, bearing and sideways trends</h2> <p>The direction of the channel can tell us whether a trend is bullish, bearish or sideways – the only three possible types of trends.<br /> <br /> If a trend is upward, it is called bullish. It can also be defined as higher highs and lower lows. A downward trend is considered bearish, as it forms lower highs and lower lows. When highs and lows are not reaching new grounds and moving horizontally instead, a trend is considered sideways.<br /> <br /> <img alt="Bullish, bearish and sideways trends" src="~/getmedia/28a29822-4d0f-42d8-98e0-8ec6c19bbc63/Bullish,-bearish-and-sideways-trends.png" /><br /> <br /> To confirm whether you have identified the correct trend, you need to wait for at least three price movements and analyse their highs and lows. On the image below, you can see how the price formed a higher high first, then a higher low and then moved past the previously formed high; hence we can consider this trend bullish.<br /> <br /> <img alt="Trend formation" src="~/getmedia/8890c69e-3dbf-4b78-8b98-28904bef66bc/Trend-formation.png" /></p> <h2>Trends within trends</h2> <p>There are two ways to look at trends. You can zoom in and consider smaller individual price movements, or you can zoom out and take a look at a bigger trend.<br /> <br /> Charles H. Dow, a founder and co-founder of multiple financial entities, such as the Dow Jones stock index and The Wall Street Journal, developed the Dow theory, where he identified three types of trends by their size:</p> <ul> <li>Minor trend – day-to-day prices; </li> <li>Secondary trend – bigger trends; </li> <li>Primary trend – long-term trends, called bull or bear trends. </li> </ul> <br /> On the image below, you can see a graphic representation of such trends:<br /> <br /> <img alt="Primary, secondary and minor trends graphic." src="~/getmedia/9865d22d-07db-4952-ae4f-4eac931f21b1/Primary,-secondary-and-minor-trends-graphic.png" /><br /> <br /> The next image shows a real-life example of all three trends within each other on a EUR/USD chart:<br /> <br /> <img alt="Primary, secondary and minor trends on a price chart" src="~/getmedia/eff31d3a-a3a2-4557-95cd-4d453d06d821/Primary,-secondary-and-minor-trends-on-a-price-chart.png" /><br /> <br /> Experienced traders tend to use a combination of different trend sizes to find the best trading opportunities. Some start from a primary trend and move inward – to the secondary one, followed by the minor one, while others do the opposite. If, during this research, breakouts overlap in multiple trend channels, it usually indicates a stronger trading signal.<br /> <br /> It can also be useful to switch timeframes to confirm the findings. For example, you can use 1-day candlesticks for primary and secondary trends and 1-hour candlesticks for minor trends identification. There are no set rules; it is up to every trader's individual preference.<br /> <br /> Essentially, no matter which trend size you are looking at, from the technical analysis standpoint, they all follow the same logic. Once the price breaks through the support or resistance, it may indicate a trading opportunity. This happens because trends tend to reverse after the breakout.<br /> <br /> <img alt="Price breakout on a chart." src="~/getmedia/a8466348-db0f-4ed4-82fb-0ceca2653a14/Price-breakout-on-a-chart.png" /> <p> </p> <h2>False breakouts</h2> <p>It is important to keep in mind that a breakout doesn't necessarily mean that the trend will reverse. Sometimes false breakouts occur, and after a short movement through a trendline, the price moves back to the channel.<br /> <br /> <img alt="False breakouts on a price chart." src="~/getmedia/76376df2-fb56-46c3-af81-e0b3bbc7007f/False-breakouts-on-a-price-chart.png" /><br /> <br /> That's why every breakout needs to be studied closely to understand whether the trend is weakening and showing signs of an upcoming reverse. It can be observed when the price stops following the trend's pattern.<br /> <br /> For example, in a bearish trend – lower highs and lower lows – the price suddenly forms a higher or equal high and a higher or equal low:<br /> <br /> <img alt="The signs of trend weaking and trend reverse." src="~/getmedia/913cfcd5-3c2b-4aa2-aebd-401e7225ddbe/The-signs-of-trend-weaking-and-trend-reverse.png" /><br /> <br /> If we zoom in on the breakout on our EUR/USD chart, we can see how It works in a real trading environment:<br /> <br /> <img alt="Studying price data to identify false breakout." src="~/getmedia/bda471ed-0370-43b4-b2e4-7c102aebb831/Studying-price-data-to-identify-false-breakout.png" /><br /> <br /> As we mentioned previously, to confirm a trend, you need to observe at least three price movements following the pattern.<br /> <br /> On the image above, when the price breaks through the resistance level in the upward movement first, the third candle has the same high as the second, which means the trend is weak. Indeed, the price returns to the channel after that, revealing the false breakout.<br /> <br /> On the contrary, the second time the price breaks through the same resistance level, the first three candles have higher highs and higher lows, forming a new bullish trend in an upward movement.<br /> <br /> However, it's important to keep in mind that any indication of a potential trading opportunity you find is no more than just an indication, and it is never a guaranteed signal. Experienced technical analysts use multiple tools to analyse price charts, compare their findings and confirm the probability of a certain price movement in the future. In our following articles, we will talk about chart patterns and technical indicators to equip you with more technical analysis tools.<br /> <br /> Meanwhile, you can practise finding support and resistance levels in a chart with your demo trading account. Identify entry points and see if the price behaves as you predicted in a risk-free trading environment with virtual money.</p>

What is technical analysis in trading?
<p>The most important part of any trading strategy is knowing when to enter and exit the market. In our previous trading guides and articles, we covered various factors influencing price movements in financial markets, such as economic indicators and political climate.<br /> <br /> Analysing such factors is called fundamental analysis, and it is a very popular method to evaluate future price movements among traders.<br /> <br /> However, some traders consider insights found with the help of fundamental analysis insufficient to provide exact buy and sell levels. That’s where technical analysis can be useful.</p> <p>In this article, we’ll explain what technical analysis is, how it works, and its main types.</p> <h2>What is technical analysis?</h2> <p>Technical analysis is the process of evaluating past price movements of an instrument to determine its future moves. The reason it’s called technical is because it’s based purely on statistics and is not affected by news, economic or political factors.<br /> <br /> While this method is widely used by traders all over the globe, it’s important to understand that past prices don’t predict or dictate future prices, and all the insights gathered with the help of technical analysis are solely indicative.<br /> <br /> Technical analysis includes multiple tools. An experienced technical analyst usually uses various combinations of them to compare results and make an informed trading decision. These tools can be divided into three categories: trend lines, chart patterns and technical indicators.<br /> <br /> All three analyse price charts. So whichever type you choose, the single most important thing is to learn how to read price charts.</p> <h2>What is a price chart?</h2> <p>A price chart in trading is a graphic sequence of historical prices of an instrument. Charts are at the heart of trading as they help traders to monitor the value of their current positions, analyse past price movements and get cues as to where the price may move next. Understanding how to read a price chart is a key step in learning technical analysis.<br /> <br /> Each trading platform offers a different set of various chart types, and the choice depends purely on a trader’s personal preference. ThinkMarkets’ proprietary platform ThinkTrader, for example, has over 15 different charts to accommodate traders’ needs.<br /> <br /> <img alt="" src="/getmedia/6aae82dc-4ad4-43ba-9b7b-fdbf2373e549/article-what-is-technical-analysis-price-chart-1.webp" style="width: 552px; height: 464px;" /><br /> <br /> Some popular ones are candlestick, bar and line charts:<br /> <br /> <img alt="" src="/getmedia/ffc042b3-bc5a-4a9e-81e8-da5cb1ba5b5c/article-what-is-technical-analysis-chart-types.webp" style="width: 552px; height: 258px;" /><br /> <br /> As a candlestick chart is the most commonly used by traders, let’s see how it works in detail.</p> <h2>Candlestick chart</h2> <p>A candlestick chart is called so because each unit of it looks like a candle. The time frame of candles can be adjusted from one minute to one month, depending on the strategy:<br /> <br /> <img alt="" src="/getmedia/0f95f823-f6c9-42e1-a8f7-dcfb6ace79e7/article-what-is-technical-analysis-candlestick-chart.webp" style="width: 552px; height: 431px;" /><br /> <br /> Regardless of the chosen time frame, each candle consists of two main elements: the wick and the body that represent four prices of an instrument:</p> <ul> <li>Opening price</li> <li>Highest price reached during the chosen period</li> <li>Lowest price reached during the chosen period</li> <li>Closing price</li> </ul> <p><br /> The candles are coloured depending on whether the market rose or fell during the selected timeframe. Green candles (white on some platforms) indicate rising or bullish prices, and red (black) represent falling prices, also called bearish.<br /> <br /> <img alt="" src="/getmedia/38272a03-b39f-4a17-85b3-e0377aacfc0a/article-what-is-technical-analysis-candlestick-wicks.webp" style="width: 552px; height: 327px;" /><br /> <br /> In technical analysis, it is exactly the relationship between individual candlesticks that helps traders predict a future price movement.</p> <h2>Types of technical analysis</h2> <p>As we mentioned above, technical analysis tools can be segregated into three categories: trend lines, chart patterns and technical indicators.</p> <h5>Trend lines</h5> <p>Prices never move in straight lines. Influenced by many factors, they move up and down, forming highs and lows. A trend means the overall direction of the price movements. Trend lines are just straight lines that traders use to connect highs and lows on a price chart to identify a trend. Some trend lines, such as support and resistance, are used to identify an entry and exit level before opening a position.<br /> <br /> In one of our following articles, we’ll explain how trend analysis works and how to identify a trend in detail.</p> <h5>Chart patterns</h5> <p>A chart pattern is a graphic sequence of lines that can be identified on a price chart. Chart patterns are very popular among traders as they can often signal the beginning, end, strengthening or weakening of a trend.<br /> <br /> We’ll go through the most popular patterns in one of our next articles as well and explain how they work.</p> <h5>Technical indicators</h5> <p>Technical analysis indicators are mathematical calculations based on historical data and used to identify price action. As complex as it sounds, traders don’t need to do the actual math. Every trading platform offers technical indicators that can be simply applied to a price chart. The main goal for a trader is to learn how to read them.<br /> <br /> Depending on their types, technical indicators can analyse trend direction and strength and identify potential entry and exit points. We will cover this topic in detail in our following articles too.<br /> <br /> For now, to start getting familiar with technical analysis, we suggest creating a <a href="~/en/demo-account">risk-free demo account</a> on ThinkTrader and studying various price charts. You will be able to use the same platform to continue your journey with technical analysis, as it offers an extensive suite of analytical tools.<br /> </p>

10 Tips to Successful Trading
<p>A solid plan for your online trading activities will provide a blueprint for your trading activities and define your goals.<br /> <br /> This, in turn, will help you stay on track and potentially avoid an undesirable outcome. Creating a trading plan involves a lot of moving parts.<br /> <br /> Creating a successful trading plan takes a little more than that. In this day trading guide, we’ve outlined ten essential steps every trading plan needs to have.</p> <h2>1. Understand the market <br /> before you start trading</h2> <p>A solid understanding of the financial market you are going to trade on is crucial for building a good trading plan. Having a strong knowledge base will help you navigate a large volume of information in a trading world confidently and make educated trading decisions.<br /> <br /> No matter what financial instruments you choose for your trading journey – forex, indices, commodities or others – there are three main points any day trader needs to focus on:</p> <ul> <li>Market terminology</li> <li>Unique traits of the market</li> <li>Factors influencing price movements</li> </ul> <div class="text-center"><img class="w-75" src="/TMXWebsite/media/TMXWebsite/circle.jpg" /></div> <p>For example, in forex, price movements are measured in pips, while in all the other markets, they are measured in ticks or points. This unique trait of each market requires an understanding of the market terminology.<<br /> <br /> Factors influencing price movements in each market will also vary. Forex, for instance, is heavily influenced by economic reports from the home countries of the traded currency pairs, while the prices of commodities are highly dependent on supply and demand. As a result, forex will move in large swings when economic reports are released, (especially reports from the US, Eurozone, or Japan), and commodities will see a lot of movement after the announcements of shortages in supply. To identify trading opportunities presented by such events, you need a clear understanding of what exactly influences each market.</p> <p>A good starting point to learn the basics of trading for beginners can be the trading guides on our website. Keep your demo account open as you go through any new information, and try to apply it in practice whenever possible.</p> <h2>2. Determine market conditions</h2> <p>Evaluating market conditions, in a nutshell, means identifying strong trading signals that present trading opportunities. To determine it, you need to be able to analyse the market you selected.<br /> <br /> There are two main methods of doing it – fundamental and technical analysis. The main difference between the two is the type of data used to predict future market movements.<br /> <br /> Technical analysis is based on the past price movements of an instrument, while fundamental analysis studies economic and financial factors that may affect the markets in future.</p> <div class="text-center"><img class="w-75" src="/TMXWebsite/media/TMXWebsite/fundamental_analyse.jpg" /></div> <p>At first, analysing financial markets may seem complicated and even intimidating. However, like with any other complex topic, you can start with a basic approach and advance little by little once you start getting a better understanding of how financial markets work.<br /> <br /> If you are just getting into day trading for beginners, it may be easier to start with news trading, identifying support and resistance levels and understanding some basic chart patterns. On the other hand, advanced traders can find trading signals in complex economic reports and technical indicators. Regardless of your experience level, you need to have a clear understanding of the analysis process you use before you start relying on it.<br /> <br /> However, whether you choose fundamental analysis, technical analysis or a mix of the two, it’s important to note that neither provides a guaranteed trading outcome. Any market analysis only indicates a potential price movement and could help determine your entry point.</p> <h2>3. Know where to enter the market</h2> <p>In trading, the entry point refers to the price level you are willing to open a trade at. While doing your market analysis, you will often see that sometimes the markets are primed for trading, while at other times it may be best to stand aside. If the trading signal you have identified is strong, you can open a trade right away. However, if you are unsure of the current market conditions or the available information is providing conflicting signals, it could be better to hold on and wait for a trade with a stronger signal.<br /> <br /> There will also be times when the signal seems strong, but your desirable entry point is not available on the market yet. In this case, you can place a pending order that will be executed only once the price reaches your specified level. Pending orders can help you manage risk and ensure that you enter the market according to your predetermined plan.<br /> <br /> To get some insights about the entry points as a trader, you can also keep an eye on the regular <a data-di-id="di-id-788ae628-c73859d3" href="/en/market-news/" rel="noreferrer noopener" target="_blank">market news</a> posted on our website by trading experts. Financial markets are unpredictable, and even experts can't guarantee the next price movement. However, they share valuable tips that may help you adjust and fine-tune your trades.</p> <div class="text-center"><img class="w-75" src="/TMXWebsite/media/TMXWebsite/laptop.jpg" /></div> <h2>4. Assess your risk appetite</h2> <p>New traders tend to have a strong aversion to risk and often focus too heavily on losses or, worse, refuse to close a losing position. They increase their risk exposure and believe that the market will return in their favour. Successful traders know there is a potential risk in every trade.<br /> <br /> That’s why setting an appropriate risk level before you start trading and sticking to it is one the most important steps of creating a day trading strategy. A wise day trader won't risk more than they can afford to lose.<br /> <br /> Determining how much of your capital you can risk per trade depends on your total trading account size and experience. Many traders use a 1-3% risk level as their control point, but beginners usually start with 1% to get comfortable with the idea. For example, if your trading capital is USD 10,000, you might decide to risk 1% per trade, which would be USD 100. However, this percentage should be based on your individual risk tolerance and trading strategy.</p> <div class="text-center"><img class="w-75" src="/TMXWebsite/media/TMXWebsite/risk-appetite_1.JPG" /></div> <p>It is not uncommon to experience strings of wins and losses, but whether you have a good day or your predictions are incorrect, it should not change your pre-determined risk level.</p> <h2>5. Understand your risk/reward ratio</h2> <p>A risk/reward ratio is a balance between how much you are willing to lose in order to gain a certain reward. Once you know your risk level, the next step is to set a desirable reward level. Just like with a 1-3% risk level, a 1:3 risk/reward ratio is widely considered appropriate among traders.<br /> <br /> It means you should expect no more than three points of return for every point you risk. So with a trading capital of USD 10,000 and a risk level of 1% (USD 100), your target return should not exceed USD 300. However, beginners often prefer to start with a lower reward level as well and set their risk/reward ratio to 1:1, which is USD 100 as a target return for every USD 100 of risk.<br /> <br /> In many cases, a reasonable reward goal will also depend on the instrument and market you are trading on. For example, you shouldn’t expect a 300-point price move from a market with a 100-point average range.</p> <div class="text-center"><img class="w-75" src="/TMXWebsite/media/TMXWebsite/risk-reward-ratio_1.JPG" /></div> <h2>6. Control your trading capital</h2> <p>The price movements on any trading market are outside your control as a trader. What you can control is the negative or positive impact any one of them has on your trading account. Risk management tools, such as stop loss and take profit, will help you keep your risk/reward ratio in check and avoid undesirable and unpredicted results.<br /> <br /> Generally speaking, every trade you place has only three possible outcomes:</p> <ul> <li>The market goes in your favour = you gain</li> <li>The market moves against you = you lose</li> <li>The market trades sideways = no gain and no loss</li> </ul> <p>To have control over your trading account, features are available to use such as take profit to lock your gains in successful trades and stop loss to limit your losses if the market moves against you.<br /> <br /> Following our previous example, for the trading account of USD 10,000 with a 1:3 risk/reward ratio, your stop loss could be set to USD 100 and take profit to USD 300. While many trading platforms will automatically calculate and display potential profit and loss for set take profit and stop loss levels, it's important for traders to understand how these levels relate to the price movement of the asset they are trading.<br /> <br /> As we mentioned earlier, following your predetermined risk level without changing it for already running trades is crucial. Many traders have made the unfortunate mistake of adjusting stop-loss orders lower and lower on a losing trade until they hit the point of ruin. Whereas other traders have adjusted take-profit orders higher and higher just to see their profits vanish as a trade quickly reverses against them.<br /> <br /> Sometimes you will find yourself in a third scenario, where the instrument you are trading on moves sideways for an extended period without bringing you the desirable gain and not triggering your stop loss. In such cases, traders often prefer to exit such trade manually, re-evaluate their trading plan and wait for a stronger trading signal.</p> <h2>7. Document your trading plan</h2> <p>The easiest way to re-evaluate your day trading plan is to go through each and every step of it and check whether the information you determined earlier is still relevant. That’s why documenting it is essential.<br /> <br /> Here are some example steps that could be included in any trading plan:</p> <ul> <li>Previous trading session review</li> <li>Existing trading opportunities analysis <ul><br /> <br /> <br /> <br /> <li> </li> <li>Macro-analysis of the current market – news, economic reports, other factors that impact markets</li> <li>Micro-analysis of the current market – review of charts and technical indicators</li> </ul> </li> <li>A defined entry point</li> <li>A defined risk you are comfortable with per trade</li> <li>Defined stop loss and take profit levels</li> </ul> <p>Every trading plan is unique and depends on the personal goal of a trader. You may follow the same steps or create different ones to match your personal trading needs – no matter which option you choose, documenting it could still help you stay on track.</p> <div class="text-center"><img class="w-75" src="/TMXWebsite/media/TMXWebsite/checklist_1.jpg" /></div> <h2>8. Put your plan to the test</h2> <p>Going through the motions of your trading plan is as important as documenting it. Use a demo account of your trading platform to test it in a simulated real-world market environment with no risk.<br /> <br /> Making an effort to practise trading on a demo account can help identify weaknesses in your trading plan and allow you to adjust it where necessary. To give your trading plan a real test, keep in mind that when trading with a demo account, it is critical to follow your plan and execute each step as if you were trading in a live environment.<br /> <br /> That means placing trades only if your plan signals it, respecting all stop-loss and take-profit levels and making adjustments or course corrections only after the end of a trading day, not during it.<br /> <br /> Many beginner traders make the mistake of not treating their demo account with the same discipline and mindset they would have for their live account with real money. As a result, when the same trading strategy is applied to a live trading account, the results will differ greatly compared to the demo account. Moreover, not following the predetermined actions will make it much harder to review and analyse your trading session later.<br /> <br /> That’s why it is important to stick to your trading plan to prepare yourself for transitioning from a demo account to live.</p> <h2>9. Remove emotions from the equation</h2> <p>Uncontrolled emotions are one of the key reasons traders abandon their trading plan and fail to achieve the outcome they seek.<br /> <br /> When you begin to trade, it is important to remove any non-related or outside influences from your environment to allow yourself to trade with a clear focus and have a better trading experience.<br /> <br /> Seasoned traders apply various techniques to eliminate emotions from day-to-day trading and follow the structure and discipline provided by a well-thought-out trading plan. Some of them use a daily ritual, such as a short checklist related to their trading plan. Others use a brief physical exercise to help clear their mind and sharpen their focus. It can be anything else that works for you personally as long as it helps to achieve the main goal – developing a process that will help you execute each and every step of your trading plan without deviation. Like any new skill you are learning, your trading process will soon develop a natural flow and become second nature as long as you stay true to it.</p> <div class="text-center"><img class="w-75" src="/TMXWebsite/media/TMXWebsite/emotions.jpg" /></div> <h2>10. Find out what type of trader you are</h2> <p>nce you run your trading strategy a few times, you will start noticing that some trades work better for you than others. That’s when you know it’s time to find out your trading personality.<br /> Understanding your own trading personality can help you achieve the most positive experience and results from your trading. Some traders are better suited for high-volume, short-term trading, while others thrive using a slower long-term style.<br /> <br /> Determining what trading style works better for you is just as important as knowing the personality of the market you decide to trade on. There are many assessments available online to help you learn more about yourself in a trading environment, as well as numerous books and articles written on trading psychology and behavioural finance. Explore who you are as an individual and how that can apply to your trading psychology and strategy.</p> <div class="text-center"><img class="w-75" src="/TMXWebsite/media/TMXWebsite/human_1.JPG" /></div> <h2>Bonus: 11. Apply discipline and consistency</h2> <p>There is no ultimate success route to trading, but as with many things in life, being disciplined and consistent could be seen as key. It may take more than one try and some patience to find out whether a certain strategy is working.<br /> <br /> Beginner traders often give up on their plans as soon as they face their first loss and move to another strategy hoping it will work better. Stay disciplined and consistent, study the details of your trading sessions and plan your next steps only with a clear understanding of what works well and what doesn’t.<br /> <br /> Ready to get stated with day trading? Start with ThinkTrader. Our award-winning platform gives access to over 4,000 financial instruments, market news and multiple analytical tools to help you define your trading plan.<br /> <br /> Try it now on the <a data-di-id="di-id-8245fa02-6d05b691" href="https://web.thinktrader.com/account/login" rel="noreferrer noopener" target="_blank">web</a> or download the app [QR code]./p></p> <p style="text-align: center;"><img alt="" class="w-25" src="~/getmedia/e1074687-a223-4ed5-a7a2-540d16d4b2cd/QR-code_1.png?width=200&height=200" style="width: 200px; height: 200px;" /></p> <p style="text-align: center;"><a class="button large hollow secondary" data-di-id="di-id-89b33f44-3ddfd855" href="/TMXWebsite/media/TMXWebsite/10-tips-to-successful-trading-pdf.pdf" onclick="DownloadFn()">Download the pdf</a></p> <p> </p>
MT4 tips and tricks
<h2><strong style="color:#007c8c;">Customising charts</strong></h2> <p>You can fully customise your charts with indicators, grids and period separators and can add and remove these as you see fit. Here are some useful keyboard shortcuts for easy removals:<span style="font-size: 1.425rem; line-height: 1.6; font-family: EncodeSans, Helvetica, Arial, sans-serif; font-weight: normal;"> </span></p> <h5><span style="font-size: 1.425rem; line-height: 1.6; font-family: EncodeSans, Helvetica, Arial, sans-serif; font-weight: normal; margin-top: 0px;"><img alt="" src="~/getmedia/ad730baa-a9bd-415e-8ac7-4ae53466cfcf/MT4-Tips-and-Tricks-Custom-Charts_1.PNG" style="vertical-align: middle; margin-top: 0px; " /></span></h5> <p><br /> <strong><img alt="" src="/TMXWebsite/media/TMXWebsite/MT4-Tips-and-Tricks-hide-the-Bid.PNG?width=300&height=204" style="width: 300px; height: 204px; float: left; margin-top: 0px; margin-right:24px; margin-bottom:8px;" />Hiding the bid line</strong><br /> If you use a lot of technical analysis, the bid line can become rather obtrusive. To remove the bid line you can set the colour of the line to ‘None’, completely removing it from the chart.</p> <h5> </h5> <p><strong><img alt="" src="/TMXWebsite/media/TMXWebsite/MT4-Tips-and-Tricks-Setting-Default-Chart.PNG?width=300&height=489" style="width: 300px; height: 489px; float: left; margin-top: 0px; margin-right:24px;" /><strong>Setting the default chart</strong></strong><br /> Once you have a chart you’re happy with, you can save it as a template. The quickest and easiest way to do this is by right-clicking on the chart and selecting “Template”, followed by “Save Template”. You can have as many templates as you like to match all of your trading strategies.<br /> If you have a preferred template that you wish to save as your default, you can do this by right-clicking on the chart, selecting “Template”, “Save As” and then “Default”.</p> <h2><strong style="color:#007c8c;">Customising toolbars</strong></h2> <p>Many of the toolbar functionalities can be distracting and you may find you don’t use all of them. With MT4 you can add in or hide as many features as you want.<br /> <img alt="" src="/TMXWebsite/media/TMXWebsite/MT4-Tips-and-Tricks-Moving-Tool-Bar.PNG?width=300&height=168" style="width: 300px; height: 168px; float: right;" /> There are four separate toolbars available:</p> <ul> <li>Standard</li> <li>Chart studies</li> <li>Line studies</li> <li>Time frames</li> </ul> <p> </p> <p> </p> <p><br /> You can move toolbars around by simply dragging them to wherever you’d like them to be.<br /> <br /> To customise what you view, you can simply right-click on the toolbar and click on the customise sub-menu. Here you can remove functions that aren’t required by un-ticking them.<br /> <br /> <img alt="" src="/TMXWebsite/media/TMXWebsite/MT4-Tips-and-Tricks-hidden-Tool.PNG?width=300&height=141" style="width: 300px; height: 141px; float: right;" />By using the customise feature on each toolbar, you can access hidden tools, while removing any you don’t require. Through this technique, you can end up with a much cleaner and more compact user interface.</p> <br /> <p><strong>Using shortcuts</strong><br /> Keyboard shortcuts are a quick and easy way to perform tasks. By using shortcuts, you can have faster access to tools – saving plenty of time in the long run. You can remove redundant information and functionalities, and most importantly increase your charting space.<br /> The following keyboard shortcuts can help to navigate your way around the platform easier:<br /> </p> <table border="1" cellpadding="0" cellspacing="0"> <tbody> <tr> <td style="width:113px;"> <p><strong>Terminal</strong></p> </td> <td style="width:85px;"> <p>Control+T</p> </td> <td style="width:403px;"> <p>This is the main window you use while trading – manage open orders, view account history and set alerts</p> </td> </tr> <tr> <td style="width:113px;"> <p><strong>Navigator</strong></p> </td> <td style="width:85px;"> <p>Control+N</p> </td> <td style="width:403px;"> <p>Add Indicators, Expert Advisors and log in</p> </td> </tr> <tr> <td style="width:113px;"> <p><strong>Market Watch</strong></p> </td> <td style="width:85px;"> <p>Control+M</p> </td> <td style="width:403px;"> <p>View available instruments</p> </td> </tr> <tr> <td style="width:113px;"> <p><strong>Data Window</strong></p> </td> <td style="width:85px;"> <p>Control+D</p> </td> <td style="width:403px;"> <p>View all data for the product currently in the chart window</p> </td> </tr> </tbody> </table> <p><br /> You can use the following shortcuts when analysing and trading, which can greatly improve the process speed of your trading:<br /> </p> <table border="1" cellpadding="0" cellspacing="0"> <tbody> <tr> <td style="width:75px;height:17px;"> <p><strong>+</strong></p> </td> <td style="width:192px;height:17px;"> <p>Zoom in</p> </td> </tr> <tr> <td style="width:75px;height:18px;"> <p><strong>-</strong></p> </td> <td style="width:192px;height:18px;"> <p>Zoom out</p> </td> </tr> <tr> <td style="width:75px;height:17px;"> <p>Control+F</p> </td> <td style="width:192px;height:17px;"> <p>Crosshair</p> </td> </tr> <tr> <td style="width:75px;height:18px;"> <p>Control+Drag</p> </td> <td style="width:192px;height:18px;"> <p>Copy objects</p> </td> </tr> <tr> <td style="width:75px;height:17px;"> <p>Alt+Drag</p> </td> <td style="width:192px;height:17px;"> <p>Extend objects</p> </td> </tr> <tr> <td style="width:75px;height:18px;"> <p>Alt+T</p> </td> <td style="width:192px;height:18px;"> <p>One-click trading</p> </td> </tr> <tr> <td style="width:75px;height:17px;"> <p>Hotkeys</p> </td> <td style="width:192px;height:17px;"> <p>User-defined shortcuts</p> </td> </tr> </tbody> </table> <p> <br /> These are the shortcuts for the more visual aspects of your charts:</p> <table border="1" cellpadding="0" cellspacing="0"> <tbody> <tr> <td style="width:75px;height:17px;"> <p>F8</p> </td> <td style="width:192px;height:17px;"> <p>Edit chart graphics</p> </td> </tr> <tr> <td style="width:75px;height:18px;"> <p>F9</p> </td> <td style="width:192px;height:18px;"> <p>Order panel</p> </td> </tr> <tr> <td style="width:75px;height:17px;"> <p>F11</p> </td> <td style="width:192px;height:17px;"> <p>Full screen chart</p> </td> </tr> <tr> <td style="width:75px;height:18px;"> <p>Alt+1</p> </td> <td style="width:192px;height:18px;"> <p>Bar charts</p> </td> </tr> <tr> <td style="width:75px;height:17px;"> <p>Alt+2</p> </td> <td style="width:192px;height:17px;"> <p>Candlestick charts</p> </td> </tr> <tr> <td style="width:75px;height:18px;"> <p>Alt+3</p> </td> <td style="width:192px;height:18px;"> <p>Line charts</p> </td> </tr> </tbody> </table> <p> <br /> <strong>Using hotkeys</strong><br /> <img alt="" src="/TMXWebsite/media/TMXWebsite/MT4-Tips-and-Tricks-Hot-Key.PNG?width=300&height=334" style="width: 300px; height: 334px; float: left;" /><br /> <br /> <br /> </p> <p><br /> In MT4, when you switch your chart templates, you’ll lose any current analysis on your charts. To prevent this, you can leave your price charts open and just change the indicators that you use – this is where hotkeys come into play. You can assign a hotkey to place a certain indicator on your charts, instead of needing to change the template.</p> <p>To assign a hotkey to an indicator, simply right-click on the indicator on the navigator window and select “Hotkey”.<br /> <br /> <br /> <img alt="" src="/TMXWebsite/media/TMXWebsite/MT4-Tips-and-Tricks-Favorite-Chart.PNG?width=300&height=182" style="width: 300px; height: 182px; float: right;" /><br /> <br /> <strong>Favourites indicators list</strong><br /> To streamline the number of indicators that are available to you, you can create a favourites list. Here’s how you can add indicators to your favourites list:</p> <ol> <li> <p>Open Navigator (Control+N)</p> </li> <li> <p>Open relevant tab (Indicators, Scripts etc)</p> </li> <li> <p>Hover mouse over desired favourite</p> </li> <li> <p>Right-click on your mouse</p> </li> <li> <p>Select ‘Add to favourites’</p> </li> </ol> <br /> <img alt="" src="/TMXWebsite/media/TMXWebsite/MT4-Tips-and-Tricks-Alert.PNG?width=300&height=365" style="width: 300px; height: 365px; float: right;" /> <strong>Alerts</strong> <p>Alerts allow you to keep track of important price levels being breached, and can further enhance your analysis and chart organisation. If you track multiple markets, it can become easy to lose track of the markets, especially after an important event and all the markets move their separate ways.<br /> To set up alerts, move your mouse to the area on the chart you’d like to set the alert at, right-click on the position, select ‘Trading’ and then ‘Alert’.</p>
Bid ask spreads
<h2>Bid-ask spread</h2> <p>A full quotation is made up of 2 prices called the bid and the ask. The difference between these two prices is referred to as the 'spread'. The spread is essentially the profit a broker or bank makes for you to enter the trade (your transactional cost). The wider the spread the more expensive it is for you to trade, whereas the thinner the spread the cheaper it is to enter the trade.<br /> </p> <p>Large and frequently traded currencies usually enjoy a small bid-ask spread while small and infrequently used currencies have a large bid-ask spread.</p> <p>The spread becomes more important to traders who trade frequently, such as an intraday traders or scalpers. However the spread is less important the higher the timeframe you trade.<br /> <br /> <img alt="" src="~/TMXWebsite/media/TMXWebsite/bid-ask_spread_1.png" /></p> <p>Here you can see the bid-ask spread when you open a deal ticket within MT4. You wish to go long (buy) EURUSD and open an order window</p> <h3>Long positions</h3> <ul> <li>The quotation reads: 1.36298 / 1.36301</li> <li>If you buy you will enter the market at 1.36301</li> </ul> <h3>Short positions </h3> <ul> <li>The quotation reads: 1.36298 / 1.36301</li> <li>If you sell you will enter the market at 1.36298</li> </ul> <p>In both circumstances your entry price on your P/L (profit loss) will be negative as the spread has been attached to your order. The market will have to move in your favour by the distance of the spread in order for your P/L to become zero.</p>
Trading 101: Dynamic leverage – what it is, how it works, and more!
<p paraeid="{0188ab9a-1a10-4ca0-a0cd-0e583ff40dfe}{250}" paraid="278386506">ThinkMarkets has just launched its new set of account types. With it comes a powerful and advanced tool that can help improve your trading experience – Dynamic leverage. <br /> </p> <p paraeid="{53584117-4d11-4bc6-a2de-46df2c0cc4e6}{5}" paraid="1688564561">This comprehensive guide aims to help you understand the mechanics of dynamic leverage, what it is, and how it works, more importantly, how you can use dynamic leverage to maximise potential profit while minimising risk exposure. </p> <h2 aria-level="2" paraeid="{53584117-4d11-4bc6-a2de-46df2c0cc4e6}{23}" paraid="1399599748" role="heading">Understanding dynamic leverage: What it is </h2> <p aria-level="2" paraeid="{53584117-4d11-4bc6-a2de-46df2c0cc4e6}{23}" paraid="1399599748" role="heading">Dynamic leverage is a mechanism that adjusts a trader's leverage based on a specific criterion determined by a broker. For example, ThinkMarkets' dynamic leverage feature relies on a trader's trade size. <br /> </p> <p paraeid="{53584117-4d11-4bc6-a2de-46df2c0cc4e6}{55}" paraid="1957324963">Unlike fixed leverage, where a trader's leverage ratio remains constant, dynamic leverage automatically changes. </p> <h2 aria-level="2" paraeid="{53584117-4d11-4bc6-a2de-46df2c0cc4e6}{61}" paraid="1459467418" role="heading">Mechanics of dynamic leverage: How it works </h2> <p paraeid="{53584117-4d11-4bc6-a2de-46df2c0cc4e6}{71}" paraid="61956003">If you trade with ThinkMarkets on an account with dynamic leverage, your leverage automatically changes depending on the size of your trade orders. Leverage and trade size, in this situation, shares an inverse relationship. As your position size increases, the leverage applied to a portion of your trade decreases. <br /> </p> <p paraeid="{53584117-4d11-4bc6-a2de-46df2c0cc4e6}{93}" paraid="579399769">The process is automatic and recalculated in real time to guarantee that your risk exposure is reduced as you undertake bigger positions. This is a particularly nifty feature for risk mitigation and helping you avoid significant losses during volatile times. </p> <h2 aria-level="2" paraeid="{53584117-4d11-4bc6-a2de-46df2c0cc4e6}{113}" paraid="533089364" role="heading">Dynamic leverage example: XAUUSD scenario </h2> <p paraeid="{53584117-4d11-4bc6-a2de-46df2c0cc4e6}{119}" paraid="432313868">Let's look at an example to visualise properly how dynamic leverage works. </p> <p paraeid="{53584117-4d11-4bc6-a2de-46df2c0cc4e6}{131}" paraid="1408111790">You decide to open a long position of 25 lots on XAUUSD, priced at 1,800. Below is the table of leverage tiers used by ThinkMarkets. </p> <p paraeid="{53584117-4d11-4bc6-a2de-46df2c0cc4e6}{152}" paraid="899852099">According to the dynamic leverage tiers provided above: <br /> </p> <ul> <li paraeid="{53584117-4d11-4bc6-a2de-46df2c0cc4e6}{162}" paraid="367445120">For the first 10 lots, you get access to a leverage of 500:1 with a margin requirement of 0.2%. </li> <li paraeid="{53584117-4d11-4bc6-a2de-46df2c0cc4e6}{173}" paraid="1262078354">The following 10 lots fall under the tier with 200:1 leverage and a 0.5% margin requirement. </li> <li paraeid="{53584117-4d11-4bc6-a2de-46df2c0cc4e6}{180}" paraid="1527732668">The remaining 5 lots are at a leverage of 100:1 with a 1% margin requirement. </li> </ul> <h2 aria-level="2" paraeid="{53584117-4d11-4bc6-a2de-46df2c0cc4e6}{191}" paraid="1480331102" role="heading">Margin requirement calculation </h2> <table aria-rowcount="5" border="1" cellpadding="5" cellspacing="0" data-tablelook="1696" data-tablestyle="MsoTableGrid" style="width:550px;"> <thead style="background-color: #3e4a5a"> <tr aria-rowindex="1" role="row"> <td data-celllook="0" role="rowheader"> <p paraeid="{53584117-4d11-4bc6-a2de-46df2c0cc4e6}{197}" paraid="1477560330" style="text-align: center"><span style="color:#ffffff;"> Position size <br /> (lots)</span> </p> </td> <td data-celllook="0" role="columnheader"> <p paraeid="{53584117-4d11-4bc6-a2de-46df2c0cc4e6}{204}" paraid="1364141596" style="text-align: center"><span style="color:#ffffff;"> Leverage</span> </p> </td> <td data-celllook="0" role="columnheader"> <p paraeid="{53584117-4d11-4bc6-a2de-46df2c0cc4e6}{213}" paraid="91376119" style="text-align: center"><span style="color:#ffffff;">Margin requirement</span> </p> </td> <td data-celllook="0" role="columnheader"> <p paraeid="{53584117-4d11-4bc6-a2de-46df2c0cc4e6}{220}" paraid="246922951" style="text-align: center"><span style="color:#ffffff;">Margin calculation for XAUUSD at $1800 </span></p> </td> <td data-celllook="0" role="columnheader"> <p paraeid="{53584117-4d11-4bc6-a2de-46df2c0cc4e6}{231}" paraid="969306125" style="text-align: center"><span style="color:#ffffff;">Margin required </span></p> </td> </tr> </thead> <tbody> <tr aria-rowindex="2" role="row"> <td data-celllook="0" role="rowheader"> <p paraeid="{53584117-4d11-4bc6-a2de-46df2c0cc4e6}{243}" paraid="1594320989" style="text-align: center">10 </p> </td> <td data-celllook="0"> <p paraeid="{53584117-4d11-4bc6-a2de-46df2c0cc4e6}{250}" paraid="357531691" style="text-align: center">500:1 </p> </td> <td data-celllook="0"> <p paraeid="{45a7d192-07e9-41a6-8c56-d613f7c443b4}{2}" paraid="153041093" style="text-align: center">0.2% </p> </td> <td data-celllook="0"> <p paraeid="{45a7d192-07e9-41a6-8c56-d613f7c443b4}{9}" paraid="1663063140" style="text-align: center">10 lots x 100 oz x 1800 </p> <p paraeid="{45a7d192-07e9-41a6-8c56-d613f7c443b4}{19}" paraid="166789265" style="text-align: center">500 </p> </td> <td data-celllook="0"> <p paraeid="{45a7d192-07e9-41a6-8c56-d613f7c443b4}{26}" paraid="347818917" style="text-align: center">$3,600 </p> </td> </tr> <tr aria-rowindex="3" role="row"> <td data-celllook="0" role="rowheader"> <p paraeid="{45a7d192-07e9-41a6-8c56-d613f7c443b4}{34}" paraid="658483082" style="text-align: center">10 </p> </td> <td data-celllook="0"> <p paraeid="{45a7d192-07e9-41a6-8c56-d613f7c443b4}{41}" paraid="458902278" style="text-align: center">200:1 </p> </td> <td data-celllook="0"> <p paraeid="{45a7d192-07e9-41a6-8c56-d613f7c443b4}{48}" paraid="389634407" style="text-align: center">0.5% </p> </td> <td data-celllook="0"> <p paraeid="{45a7d192-07e9-41a6-8c56-d613f7c443b4}{55}" paraid="1145375416" style="text-align: center">10 lots x 100 oz x 1800 </p> <p paraeid="{45a7d192-07e9-41a6-8c56-d613f7c443b4}{61}" paraid="583617992" style="text-align: center">200 </p> </td> <td data-celllook="0"> <p paraeid="{45a7d192-07e9-41a6-8c56-d613f7c443b4}{68}" paraid="378543494" style="text-align: center">$9,000 </p> </td> </tr> <tr aria-rowindex="4" role="row"> <td data-celllook="0" role="rowheader"> <p paraeid="{45a7d192-07e9-41a6-8c56-d613f7c443b4}{76}" paraid="1192086914" style="text-align: center">5 </p> </td> <td data-celllook="0"> <p paraeid="{45a7d192-07e9-41a6-8c56-d613f7c443b4}{83}" paraid="498187169" style="text-align: center">100:1 </p> </td> <td data-celllook="0"> <p paraeid="{45a7d192-07e9-41a6-8c56-d613f7c443b4}{90}" paraid="505165159" style="text-align: center">1% </p> </td> <td data-celllook="0"> <p paraeid="{45a7d192-07e9-41a6-8c56-d613f7c443b4}{97}" paraid="304540604" style="text-align: center">10 lots x 100 oz x 1800 </p> <p paraeid="{45a7d192-07e9-41a6-8c56-d613f7c443b4}{103}" paraid="1766904942" style="text-align: center">100 </p> </td> <td data-celllook="0"> <p paraeid="{45a7d192-07e9-41a6-8c56-d613f7c443b4}{110}" paraid="664003524" style="text-align: center">$9,000 </p> </td> </tr> <tr aria-rowindex="5" role="row"> <td data-celllook="0" role="rowheader"> <p paraeid="{45a7d192-07e9-41a6-8c56-d613f7c443b4}{118}" paraid="2065218661" style="text-align: center">Total size </p> </td> <td data-celllook="0"> <p paraeid="{45a7d192-07e9-41a6-8c56-d613f7c443b4}{127}" paraid="1523390084" style="text-align: center">25 lots </p> </td> <td data-celllook="0"> <p paraeid="{45a7d192-07e9-41a6-8c56-d613f7c443b4}{134}" paraid="420359243" style="text-align: center"> </p> </td> <td data-celllook="0"> <p paraeid="{45a7d192-07e9-41a6-8c56-d613f7c443b4}{139}" paraid="1809839187" style="text-align: center"> </p> </td> <td data-celllook="0"> <p paraeid="{45a7d192-07e9-41a6-8c56-d613f7c443b4}{144}" paraid="581316709" style="text-align: center">$21,600.00 </p> </td> </tr> </tbody> </table> <p paraeid="{45a7d192-07e9-41a6-8c56-d613f7c443b4}{154}" paraid="1627421560"><br /> This means that for your 25-lot position on XAUUSD, the total margin required would be $21,600, given the price was 1,800. </p> <h2 aria-level="2" paraeid="{45a7d192-07e9-41a6-8c56-d613f7c443b4}{168}" paraid="675519154" role="heading">Advantages of dynamic leverage: Why it's good for traders </h2> <p paraeid="{45a7d192-07e9-41a6-8c56-d613f7c443b4}{180}" paraid="858754147">While the notion of Dynamic leverage might sound intimidating, it offers several benefits that can elevate your trading: </p> <h3 aria-level="3" paraeid="{45a7d192-07e9-41a6-8c56-d613f7c443b4}{196}" paraid="1962088252" role="heading">Risk management </h3> <p paraeid="{45a7d192-07e9-41a6-8c56-d613f7c443b4}{202}" paraid="1189862223">Dynamic leverage automatically adjusts to the size of your open positions, which helps manage risk more effectively. As you increase your position size, your leverage decreases, reducing the potential for significant losses relative to your account balance. This built-in risk control mechanism is especially valuable during times of increased market volatility, where price fluctuations can be more pronounced. </p> <h3 aria-level="3" paraeid="{45a7d192-07e9-41a6-8c56-d613f7c443b4}{236}" paraid="952117703" role="heading">Flexibility </h3> <p paraeid="{45a7d192-07e9-41a6-8c56-d613f7c443b4}{242}" paraid="1314929708">The ability to open positions with higher leverage allows you to maximise your trading potential even with limited capital. Higher leverage means less capital is required to open a position, giving you the opportunity to make significant profits from relatively small price movements. ThinkMarkets offers leverage as high as 2000:1 with the Mini account on select markets. Please note that higher leverage can increase profits but also increases the risk of losses. </p> <h3 aria-level="3" paraeid="{d5dc342c-a9cb-4381-a023-abdb11e42ca1}{15}" paraid="1933726148" role="heading">Capital preservation </h3> <p paraeid="{d5dc342c-a9cb-4381-a023-abdb11e42ca1}{21}" paraid="1498073827">One of the primary goals of trading is to preserve your capital while generating returns. By scaling down leverage on larger trades, dynamic leverage prevents you from overexposing yourself to the market. This is crucial for long-term trading sustainability, as it helps ensure that you do not quickly deplete your trading capital, allowing you to continue trading even after a series of losses. </p> <h2 paraeid="{d5dc342c-a9cb-4381-a023-abdb11e42ca1}{21}" paraid="1498073827">How to integrate Dynamic leverage into your trading strategy </h2> <p paraeid="{d5dc342c-a9cb-4381-a023-abdb11e42ca1}{57}" paraid="2049712165">Get a feel of dynamic leverage by starting small. Our Mini account allows traders up to 2000:1 leverage with only a required minimum deposit of $10. Take advantage of this higher leverage for potential greater returns. <br /> </p> <p paraeid="{d5dc342c-a9cb-4381-a023-abdb11e42ca1}{81}" paraid="1108824244">Make sure you closely monitor your positions to understand how your leverage changes as you scale your trade size. We recommend using take-profit and stop-loss orders to secure profits and manage risk effectively. <br /> </p> <p paraeid="{d5dc342c-a9cb-4381-a023-abdb11e42ca1}{95}" paraid="434903734">As you adjust to having Dynamic leverage in your trading, familiarise yourself with the leverage tiers offered on your preferred market. Calculate your margin requirements correctly to avoid prematurely triggering a margin call. <br /> </p> <p paraeid="{d5dc342c-a9cb-4381-a023-abdb11e42ca1}{107}" paraid="341621967">To sum up, Dynamic leverage offers traders a significant advantage and the flexibility to pursue aggressive strategies in small positions while preserving capital and managing risk as exposure grows. However, it's crucial to understand and anticipate the risks associated with trading. <br /> </p> <p paraeid="{d5dc342c-a9cb-4381-a023-abdb11e42ca1}{129}" paraid="475202109">Trade with Dynamic leverage in a simulated trading environment risk-free by creating a Mini demo account. </p>

Order types
<h3>Market orders</h3> <p>Market orders are placed at the next available market price, which means the trader will enter the trade manually. Intraday traders and in particular scalpers are likely to use market orders to enter the market.<br /> </p> <h3>Pending orders</h3> <p>These are orders placed that will become active trades if price crosses a specified price level. These are useful if you are an EOD (End of Day) Trader who will not be in front of the screens to monitor price. They’re also ideal to trade ‘breakouts’ (meaning when price moves out of a trading range) or for trading pullbacks. Pending orders come in two varieties.<br /> </p> <h3>Pending orders</h3> <ul> <li>Stop orders, which are orders to sell below the current price or orders to buy above the current price</li> <li>Limit orders, which are the inverse of stop orders: orders to sell above the current price, or buy below the current price</li> </ul> <h3><br /> Stop orders illustrated</h3> <p>The chart below illustrates buy stop orders (buying at a higher price) and sell stop orders (selling at a lower price). These orders can be used to cap losses; for instance, you can place a sell stop order to close out a buy order you placed earlier, and thus limit your potential losses. Alternatively, stop orders can be used as part of momentum strategies (for instance, if you want to initiate a sell order, but only after price has begun gaining downward momentum).<br /> <br /> <img alt="" src="~/TMXWebsite/media/TMXWebsite/order_types_2.png" /><br /> <br /> </p> <h3>Limit orders illustrated</h3> <p>The chart below illustrates buy limit orders (buying at a lower price) as well as sell limit orders (selling at a higher price). These orders are useful for customers who wish to sell an asset they bought previously at a higher price, thus locking in a profit, or to buy automatically if price falls.</p> <p>Stops and limits can be particularly useful for customers who wish to carefully control their risk exposure. See the <a href="~/en/trading-academy">ThinkMarkets trading guides</a> for advanced strategies on using stops and limits.</p>
Traders’ Gym 101: How to use ThinkMarkets’ exclusive backtesting tool
<p paraeid="{7c90bd47-7d9d-45e3-adca-ddf4dd5c5c68}{192}" paraid="684400438">If you could go back in the past, what would you do differently? <br /> </p> <p paraeid="{7c90bd47-7d9d-45e3-adca-ddf4dd5c5c68}{208}" paraid="957565690">In the world of trading, split-second decisions can result in thousands of dollars of profit or loss. It is not uncommon to hear stories of distressed traders missing a golden opportunity because of hesitation or, worse, lamenting about a bad trade that lost them a huge amount of money. <br /> </p> <p paraeid="{7c90bd47-7d9d-45e3-adca-ddf4dd5c5c68}{226}" paraid="1861411546">When the markets are highly volatile, having a robust, tried and tested trading strategy is doubly important. With a game plan in mind, traders avoid making huge mistakes, such as impulsive trades brought upon by emotions or FOMO. <br /> <br /> So, how do you build a trading strategy that you think could work? With backtesting, of course! <br /> </p> <p paraeid="{39090e05-068c-41e7-9cf0-595c1a4b6e3f}{13}" paraid="2026032670">Introducing Traders' Gym, ThinkMarkets' exclusive backtesting tool. By using Traders' Gym, traders can access real-life historical data and test their trading strategies to determine how they would have fared at that particular time. </p> <h3 aria-level="2" paraeid="{39090e05-068c-41e7-9cf0-595c1a4b6e3f}{31}" paraid="26210393" role="heading">What is backtesting? </h3> <p paraeid="{39090e05-068c-41e7-9cf0-595c1a4b6e3f}{43}" paraid="851200962">Backtesting is a data-driven process to evaluate the performance and efficiency of a trading strategy using historical market data. With a backtesting tool, traders can assess how a plan would have performed had they opened a position at the time. </p> <h3 aria-level="2" paraeid="{39090e05-068c-41e7-9cf0-595c1a4b6e3f}{49}" paraid="1706898775" role="heading">What is Traders' Gym? </h3> <p paraeid="{39090e05-068c-41e7-9cf0-595c1a4b6e3f}{57}" paraid="1532789690">Traders' Gym is ThinkMarkets' backtesting tool, available exclusively on ThinkTrader, its proprietary and award-winning trading platform. </p> <p paraeid="{39090e05-068c-41e7-9cf0-595c1a4b6e3f}{63}" paraid="346267293">Accessible to all ThinkTrader live account holders, Traders' Gym allows traders to enter a simulated market and choose a specific timeframe for testing. It offers a unique opportunity to gain valuable insights into a strategy's effectiveness and how to improve decision-making. </p> <h3 aria-level="2" paraeid="{39090e05-068c-41e7-9cf0-595c1a4b6e3f}{69}" paraid="1623950747" role="heading">How to use Traders' Gym? </h3> <p paraeid="{39090e05-068c-41e7-9cf0-595c1a4b6e3f}{77}" paraid="1416734207">We created a beginner-friendly video on how you can develop and test your trading strategy using Traders' Gym here. <br /> <br /> <a href="https://www.youtube.com/watch?v=kJ7pQM8g_EE" rel="noreferrer noopener" target="_blank">Traders' Gym: Develop and Test Your Trading Strategy</a> <br /> </p> <iframe allow="accelerometer; autoplay; clipboard-write; encrypted-media; gyroscope; picture-in-picture" allowfullscreen="" data-gtm-yt-inspected-12805312_132="true" data-gtm-yt-inspected-6="true" data-gtm-yt-inspected-9="true" frameborder="0" height="315" id="614567584" src="https://www.youtube.com/embed/kJ7pQM8g_EE?si=Hy7XMCrzS5RB9AAQ enablejsapi=1&origin=https%3A%2F%2Fwww.thinkmarkets.com" title="Live Market Analysis Webinar: 7 September 2021" width="566"></iframe> <h3 aria-level="2" paraeid="{39090e05-068c-41e7-9cf0-595c1a4b6e3f}{96}" paraid="1449664235" role="heading"><br /> Benefits of backtesting </h3> <p paraeid="{39090e05-068c-41e7-9cf0-595c1a4b6e3f}{106}" paraid="1853098259">Here's why you should include backtesting when you're building your trading strategy. <br /> </p> <ul> <li aria-level="3" paraeid="{39090e05-068c-41e7-9cf0-595c1a4b6e3f}{112}" paraid="1912719269" role="heading"><strong>Validate your strategy</strong></li> </ul> <p paraeid="{39090e05-068c-41e7-9cf0-595c1a4b6e3f}{120}" paraid="57901308">Gain an extra layer of confidence in your trading strategy by identifying whether it would have been profitable in the past. <br /> </p> <ul> <li aria-level="3" paraeid="{39090e05-068c-41e7-9cf0-595c1a4b6e3f}{126}" paraid="286902670" role="heading"><strong>Manage your risk </strong></li> </ul> <p paraeid="{39090e05-068c-41e7-9cf0-595c1a4b6e3f}{134}" paraid="537820592">Understand the potential risks associated with your strategies, including drawdowns, maximum losses, and the risk of such events. Adjust your take profit and stop loss depending on your risk tolerance. <br /> </p> <ul> <li aria-level="3" paraeid="{39090e05-068c-41e7-9cf0-595c1a4b6e3f}{140}" paraid="1952016635" role="heading"><strong>Enhance your skills risk-free </strong></li> </ul> <p paraeid="{39090e05-068c-41e7-9cf0-595c1a4b6e3f}{148}" paraid="673426426">Train your skills and execute your strategies under actual market conditions without the risk of losing money. As it is historical data, try multiple strategies using the same timeframe. </p> <h3 aria-level="2" paraeid="{39090e05-068c-41e7-9cf0-595c1a4b6e3f}{154}" paraid="1775050610" role="heading">Sign up for an account </h3> <p paraeid="{39090e05-068c-41e7-9cf0-595c1a4b6e3f}{162}" paraid="1549691577">Traders' Gym is free for all live ThinkTrader account holders. <a href="https://portal.thinkmarkets.com/account/individual" target="_blank">Open an account today</a> and start testing your strategies under real historical data. </p> <p paraeid="{39090e05-068c-41e7-9cf0-595c1a4b6e3f}{168}" paraid="429489726">Step into the future of trading with ThinkTrader and use the past as a learning experience. <br /> </p> <p paraeid="{39090e05-068c-41e7-9cf0-595c1a4b6e3f}{184}" paraid="496255478">Please note that past performance does not guarantee future returns. </p>
ThinkTrader Web - TradingView User Guide
ThinkTrader Web enters a new era with the integration of TradingView charts. TradingView’s intuitive and powerful charts are designed to aid you in making more informed trading decisions. These charts cater to all levels of experience, whether you’re a seasoned trader or just starting out. <br /> <br /> Discover ThinkTrader Web’s new charting interface, powered by TradingView, for a seamless and efficient way to monitor and analyse the markets. <br /> <h2>What is TradingView? </h2> <br /> TradingView is a cutting-edge trading chart provider that has revolutionised the way traders access market data. Globally known for its user-friendly interface combined with powerful analytical features, TradingView offers a comprehensive range of charting tools for better decision making. <br /> <h2>How to access TradingView charts on ThinkTrader Web? </h2> <br /> TradingView charts are fully integrated into ThinkTrader Web’s interface. To access the charts, all you need to do is log in on ThinkTrader Web. <br /> <br /> Don’t have an account yet? No problem. Simply head to ThinkPortal and open a new account. <br /> <h2>TradingView features </h2> <br /> As you log in to ThinkTrader Web, you will immediately get access to TradingView’s charting interface. Here are the key components and features that TradingView offers. <br /> <h2>Chart types </h2> <br /> <br /> <img alt="" src="https://k13-dev.thinkmarkets.com/TMXWebsite/media/TMXWebsite/Picture1_1.png" /><br /> <br /> TradingView’s sleek chart windows are where you’ll spend most of your time analysing the markets. The chart window displays price movements in your chosen chart type. <br /> <br /> Choose from TradingView’s 13 chart types to complement your trading strategy: <br /> <ul> <li>Bars </li> <li>Candles </li> <li>Hollow candles </li> <li>Columns </li> <li>Line </li> <li>Line with markers </li> <li>Step line </li> <li>Area </li> <li>HLC area </li> <li>Baseline </li> <li>High-low </li> <li>Heikin Ashi </li> <li>Renko </li> <li>Line break </li> <li>Kagi </li> <li>Point & figure </li> </ul> <h2>Time frames </h2> <br /> <img alt="" src="https://k13-dev.thinkmarkets.com/TMXWebsite/media/TMXWebsite/Picture2_1.png" /> <p lang="EN-US" paraeid="{718c8ab3-2f86-41d5-820e-7a267a8e494f}{242}" paraid="708463589" xml:lang="EN-US">TradingView offers a versatile range of time frames, allowing traders to analyse market trends and patterns over various periods. Understanding these time frames effectively is crucial for both short- and long-term trading strategies. <br /> </p> <p lang="EN-US" paraeid="{cf50c9b3-2300-4900-9796-20ebcc563090}{12}" paraid="1680187893" xml:lang="EN-US">Located at the top of the TradingView chart window, click the button to open a dropdown menu for different time frames. This feature allows for quick and easy switching between various periods. TradingView offers a variety of options that you can maximise for better decision making. <br /> </p> <ul> <li lang="EN-US" paraeid="{e1e67508-3f48-4237-bbf4-e81fe81035b7}{122}" paraid="1900490906" xml:lang="EN-US">1 minute </li> <li lang="EN-US" paraeid="{e1e67508-3f48-4237-bbf4-e81fe81035b7}{126}" paraid="665826024" xml:lang="EN-US">5 minutes </li> <li lang="EN-US" paraeid="{e1e67508-3f48-4237-bbf4-e81fe81035b7}{130}" paraid="1545845398" xml:lang="EN-US">10 minutes </li> <li lang="EN-US" paraeid="{e1e67508-3f48-4237-bbf4-e81fe81035b7}{134}" paraid="428893242" xml:lang="EN-US">15 minutes </li> <li lang="EN-US" paraeid="{e1e67508-3f48-4237-bbf4-e81fe81035b7}{138}" paraid="1923105792" xml:lang="EN-US">30 minutes </li> <li lang="EN-US" paraeid="{e1e67508-3f48-4237-bbf4-e81fe81035b7}{142}" paraid="1102247723" xml:lang="EN-US">1 hour </li> <li lang="EN-US" paraeid="{e1e67508-3f48-4237-bbf4-e81fe81035b7}{146}" paraid="61749682" xml:lang="EN-US">4 hours </li> <li lang="EN-US" paraeid="{e1e67508-3f48-4237-bbf4-e81fe81035b7}{150}" paraid="200973453" xml:lang="EN-US">1 day </li> <li lang="EN-US" paraeid="{e1e67508-3f48-4237-bbf4-e81fe81035b7}{154}" paraid="129446316" xml:lang="EN-US">1 week </li> <li lang="EN-US" paraeid="{e1e67508-3f48-4237-bbf4-e81fe81035b7}{158}" paraid="1655478611" xml:lang="EN-US">1 month </li> </ul> <p lang="EN-US" paraeid="{cf50c9b3-2300-4900-9796-20ebcc563090}{84}" paraid="1855050964" xml:lang="EN-US">The choice of time frame should align with your trading style and strategy. Short-term traders might prefer minute or hourly charts for quick trades, while long-term traders may opt for daily or weekly charts to understand longer-term trends. </p> <p aria-level="3" lang="EN-US" paraeid="{95f4d214-13f1-493f-999c-c0f1711e3328}{189}" paraid="1551297004" role="heading" xml:lang="EN-US"> </p> <h2>Drawing tools </h2> <br /> <br /> <img alt="" src="https://k13-dev.thinkmarkets.com/TMXWebsite/media/TMXWebsite/Picture3_1.png" /><br /> <p> </p> <p lang="EN-US" paraeid="{c9d6b04d-93c1-4191-bfb6-bbd2c09dc594}{245}" paraid="949779766" xml:lang="EN-US">Situated at the side of the chart window, this toolbar contains an extensive set of drawing tools. These tools are crucial for chart mark-ups, trend analysis, and pattern identification. Here's an overview of what you can expect and how to use them: </p> <p lang="EN-US" paraeid="{cba26489-6615-4d0f-ae16-b5f65ce0b2b9}{26}" paraid="892481004" xml:lang="EN-US">Located on the left side of the chart window, the side toolbar features various icons. Each icon represents a different drawing tool or function. </p> <p lang="EN-US" paraeid="{cba26489-6615-4d0f-ae16-b5f65ce0b2b9}{59}" paraid="724538946" xml:lang="EN-US">Types of drawing tools available on ThinkTrader Web: <br /> </p> <ul> <li lang="EN-US" paraeid="{cba26489-6615-4d0f-ae16-b5f65ce0b2b9}{68}" paraid="519850178" xml:lang="EN-US">Trend lines and arrows - essential for identifying and marking trend directions </li> <li lang="EN-US" paraeid="{39836a35-0514-4a22-ad62-c2a20153ac60}{121}" paraid="227503749" xml:lang="EN-US">Geometric shapes - useful for highlighting key chart areas or patterns like triangles, rectangles, and circles </li> <li lang="EN-US" paraeid="{657fe92a-fa54-41a8-b95d-ec5727fc040e}{12}" paraid="218871322" xml:lang="EN-US">Fibonacci tools - these include retracement, extension tools, and circles for understanding potential support and resistance levels </li> <li lang="EN-US" paraeid="{657fe92a-fa54-41a8-b95d-ec5727fc040e}{192}" paraid="1147681384" xml:lang="EN-US">Drawing tools - text and emoticons for adding notes directly on your chart </li> <li lang="EN-US" paraeid="{832c159a-f00e-4113-81a4-417dabdc699a}{97}" paraid="1476881051" xml:lang="EN-US">Customisation - Each tool comes with customisation options. Right-click on a drawn object to change the colour, thickness, and style </li> </ul> <p lang="EN-US" paraeid="{cba26489-6615-4d0f-ae16-b5f65ce0b2b9}{122}" paraid="371495218" xml:lang="EN-US">All your drawn elements can be easily edited, moved, or deleted. You can also clone or lock them in place for more detailed analysis. Traders often practice drawing trend lines to connect significant highs and lows and use geometric shapes to identify chart patterns. </p> <p aria-level="3" lang="EN-US" paraeid="{bb7f673e-e845-4e2b-b67f-2f9a6cf4e91d}{6}" paraid="1730647718" role="heading" xml:lang="EN-US"> </p> <h2>Indicators and Strategies </h2> <br /> <br /> <img alt="" src="https://k13-dev.thinkmarkets.com/TMXWebsite/media/TMXWebsite/Picture4-(1).png" /><br /> <p> </p> <p lang="EN-US" paraeid="{bb7f673e-e845-4e2b-b67f-2f9a6cf4e91d}{14}" paraid="55051457" xml:lang="EN-US">TradingView boasts a comprehensive range of powerful technical indicators and strategies. Traders consider indicators as vital tools that offer deep insights into market trends and potential trading opportunities. </p> <p lang="EN-US" paraeid="{68a07262-9361-4e05-a1dc-85ba2331ace0}{199}" paraid="1524655134" xml:lang="EN-US">To access the list of indicators, click on the ‘Indicators’ button located at the top toolbar. This will open a window showcasing a wide range of available indicators. </p> <p lang="EN-US" paraeid="{17cc8b44-01ec-4ab6-8dde-7befa4932def}{238}" paraid="1158372656" xml:lang="EN-US"><strong>Types of indicators available: </strong><br /> </p> <ul> <li lang="EN-US" paraeid="{ef91d53e-af02-45bb-ada7-31b5e7bd31e2}{1}" paraid="201540585" xml:lang="EN-US">Trend indicators - such as Moving Averages, Bollinger Bands, and MACD help identify the market trend </li> <li lang="EN-US" paraeid="{255c9261-bc76-4423-810b-c108bf45a7f8}{155}" paraid="622257580" xml:lang="EN-US">Momentum indicators – such as the RSI and Stochastic Oscillator indicate overbought or oversold conditions </li> <li lang="EN-US" paraeid="{2c1eae90-835f-4670-9106-b0618e63b58b}{44}" paraid="1992357696" xml:lang="EN-US">Volume indicators – such as Volume Oscillator and On-Balance Volume provide insights into trading volume and market strength </li> <li lang="EN-US" paraeid="{4685afcb-e3c3-480c-8dbb-6935a5e69294}{171}" paraid="1496369134" xml:lang="EN-US">Volatility indicators – such as ATR and Bollinger Bands give an idea about market volatility </li> </ul> <p lang="EN-US" paraeid="{7c58c32e-ad72-4904-942c-9748ed6d60f6}{72}" paraid="666409873" xml:lang="EN-US">To apply an indicator, simply select your desired indicator from the list. You can customise its parameters and appearance according to your trading style. </p> <p lang="EN-US" paraeid="{50db5711-d709-4538-b92f-df4c05ad377f}{82}" paraid="1420725562" xml:lang="EN-US">TradingView also allows multiple indicators to be applied on the same chart. This offers a more comprehensive analysis to validate trading signals. Once you've set up an indicator, you can save these settings for future use, ensuring consistency in your analysis. </p> <h2 aria-level="3" lang="EN-US" paraeid="{dbdf2e4c-38d3-45e0-a1b5-bdb919d85850}{173}" paraid="1235315722" role="heading" xml:lang="EN-US">Bottom toolbar <br /> </h2> <p lang="EN-US" paraeid="{5253e938-9b7e-451a-ba5a-dec57eb029f3}{218}" paraid="269356383" xml:lang="EN-US">The bottom toolbar on TradingView offers multiple features essential for market analysis. <br /> <br /> <img alt="" src="https://k13-dev.thinkmarkets.com/TMXWebsite/media/TMXWebsite/Picture5-(1).png" /><br /> <br /> Time scale adjustments – this feature lets you modify the time scale of the chart, which is useful for viewing market movements over different periods. This can range from minute-by-minute changes to broader historical trends.<br /> <br /> <img alt="" src="https://k13-dev.thinkmarkets.com/TMXWebsite/media/TMXWebsite/Picture6-(1).png" /><br /> <br /> Date range selection: Easily select and view a specific date range on your chart. This is useful for focusing on a particular period of interest, like post-announcement effects or during significant economic events.</p> <h2 lang="EN-US" paraeid="{5253e938-9b7e-451a-ba5a-dec57eb029f3}{218}" paraid="269356383" xml:lang="EN-US">Multi-chart display</h2> <p lang="EN-US" paraeid="{5253e938-9b7e-451a-ba5a-dec57eb029f3}{218}" paraid="269356383" xml:lang="EN-US"><img alt="" src="https://k13-dev.thinkmarkets.com/TMXWebsite/media/TMXWebsite/Picture7-(1).png" /><br /> <br /> TradingView on ThinkTrader Web offers a multi-chart display feature that allows traders to simultaneously monitor up to 8 different instruments.<br /> <br /> Click the layout button located on the top toolbar to open a dropdown menu with options of different chart layouts. These range from a single chart view to multiple chart layouts, allowing you to view up to 8 charts simultaneously.<br /> <br /> To set up a multi-chart display, choose your preferred layout, depending on how many markets you wish to track at once. You can display different instruments or timeframes on each chart so you can compare multiple markets or strategies in real-time.<br /> <br /> Within the multi-chart layout, each chart can be customised independently. Apply different indicators, drawing tools, and timeframes to each chart based on your trading strategy. This flexibility is perfect for traders who monitor correlations between different instruments or need to keep an eye on various segments of the market simultaneously.<br /> <br /> However, TradingView also offers the convenience of synchronisation. You can sync tools, drawings, and indicators across all charts in your layout. This ensures consistency in your analysis and saves time, especially when comparing similar markets.<br /> </p> <h2>TradingView on ThinkTrader Web</h2> <p lang="EN-US" paraeid="{5253e938-9b7e-451a-ba5a-dec57eb029f3}{218}" paraid="269356383" xml:lang="EN-US">ThinkTrader provides traders access to thousands of instruments across global financial markets, such as forex, stocks, indices, cryptocurrencies, commodities, ETFs, and futures. Level up your trading by maximising TradingView’s powerful features and ThinkMarkets’ excellent trading conditions today.<br /> If you have any questions regarding TradingView and ThinkTrader Web, our 24/7 client support team is available via live chat, email, or phone, and can support in 20+ languages.</p>
Trading styles
<h3>Trading styles</h3> <p>Here we will discuss the trading styles you are likely to come across. What typically separates the trading styles is the length of time you intend to be in a trade, the timing of your entry and in some cases, the frequency of the trades.</p> <p>There are no strict rules as to which timeframes a particular trader would use to trade, however the table below provides typical timeframes you would expect to see a trader using.</p> <div class="smallmargin-bottom"><img alt="Trading styles" src="/TMXWebsite/media/TMXWebsite/trading_styles_1.png" /></div> <div class="text-center smallmargin-bottom"><img alt="Trading styles" src="/TMXWebsite/media/TMXWebsite/trading_styles_2.png" /></div> <h3>EOD (End of Day)</h3> <div class="smallmargin-bottom"><img alt="Trading styles" src="/TMXWebsite/media/TMXWebsite/trading_styles_3.png" /></div> <p>This is a popular trading style for anyone who works full time. They may analyse the markets on a daily or weekly basis and set pending orders to catch price moves as they evolve – they will not be watching the screens when their orders trigger.</p> <p>If you have a busy lifestyle this may be a suitable method because it requires less time in front of the screen to analyse or manage the trade.</p> <h3>Fundamental (Macro Trading)</h3> <div class="smallmargin-bottom"><img alt="Trading styles" src="/TMXWebsite/media/TMXWebsite/trading_styles_3-(1).png" /></div> <p>Using Fundamental information and/or financial models to assess the strength or weakness of a stock, currency, market, or country to anticipate future price value. The source of information would vary between stocks and forex as they are are also affected by internal news of a particular company, as well as macro information.</p> <h3>Intraday trading</h3> <div class="smallmargin-bottom"><img alt="Trading styles" src="/TMXWebsite/media/TMXWebsite/trading_styles_4.png" /></div> <p>An intraday trader opens and closes a trade within the same day. Swing trading the 1HR chart could be included as Day Trading, and day-trading has a lot more emphasis on Technicals over fundamentals.</p> <p>There are also different forms of intraday trading which are covered in detail below, including: Scalping; News Trading; Swing Trading; Trend Trading.</p> <h3>News trading</h3> <div class="smallmargin-bottom"><img alt="Trading styles" src="/TMXWebsite/media/TMXWebsite/trading_styles_5.png" /></div> <p>News traders tend to specialise in ‘Red News’ events and trade during, or around the release of an important news release. Extreme volatility can occur if a surprise figure is released (which is not widely anticipated by the markets) which creates opportunity to make more profit over a very short period of time. However, longer-term moves may also unfold after an important event which may get the interest of macro traders to trade on the longer term trend, however news trading typically relates to short-term events.</p> <h3>Position trading</h3> <div class="smallmargin-bottom"><img alt="Trading styles" src="/TMXWebsite/media/TMXWebsite/trading_styles_3-(2).png " /></div> <p>A type of trader who holds a position for the long term (from weeks, to months to years). Long-term traders are not concerned with short-term fluctuations because they believe that their long-term investment horizons will smooth these out.</p> <p>Position traders tend to use a lot more fundamental information due to the longer holding time of the trade, yet they may also be purely technical. Position traders and swing traders are more likely to use pending orders to enter the market, as they don’t need to be at the screen when their trade enters or exits.</p> <h3>Scalping</h3> <div class="smallmargin-bottom"><img alt="Trading styles" src="/TMXWebsite/media/TMXWebsite/trading_styles_6.png" /></div> <p>Scalping is a form of intraday trading, and unlike the other styles, you must stay glued to your screen as if your life depends on it.</p> <p>Whilst it is an extremely popular form of trading due to the higher potential for profits, it is also one of the harder styles to master as it requires a lot more discipline from the trader. Despite this last point, scalping typically attracts the most interest from newer traders.</p> <p>Intraday and scalpers will use 1-click trading to enter the market live because a quick entry is very important to them.</p> <h3>Swing trading</h3> <div class="smallmargin-bottom"><img alt="Trading styles" src="/TMXWebsite/media/TMXWebsite/trading_styles_7.png" /></div> <p>As a swing trader you are literally trying to trade the swing of a chart and hope to catch a big move. Popular timeframes are to enter on the daily chart, and hold a position for days, or sometimes weeks. However, the 1 hour charts are also very popular with a view to hold a position for a few hours, or maybe overnight and potentially for a few days.</p> <h3>Technical trading</h3> <div class="smallmargin-bottom"><img alt="Trading styles" src="/TMXWebsite/media/TMXWebsite/trading_styles_8.png" /></div> <p>Analyse, enter, manage and exit their trading using technical analysis. This can be performed on any timeframe, although generally speaking ‘technicals’ are more popular on intraday timeframes, however technical analysis can also be used for long-term forecasting.</p> <h3>Trend trading</h3> <div class="smallmargin-bottom"><img alt="Trading styles" src="/TMXWebsite/media/TMXWebsite/trading_styles_9.png" /></div> <p>The object here is to identify a trend and only trade in the same direction as the suspected trend. Traditionally trends traders were associated with long-term fund managers, however in reality you can become a trend trader on any timeframe you choose as all timeframes trend.</p>
How to start trading the markets
<h2 id="how-to-start-heading-unique-id-1">Step 1 – Apply for an account with us</h2> We offer a wide range of financial instruments to trade across two of the industry’s leading platforms: MetaTrader 4 (MT4) and our very own ThinkTrader®. Simply apply for an account and provide us with the requested documentation and once approved, we’ll provide you with your login details to access your trading account for the very first time.<br /> <br /> <a href="https://portal.thinkmarkets.com/account/register/live?lang=en" id="button-one">Apply today</a><br /> <h2 id="how-to-start-heading-unique-id-2">Step 2 – Time to fund</h2> Once your account is opened you’ll be able to fund it and place your first trade. Funding your account is simple with our online client portal, ThinkPortal. In ThinkPortal you’ll have access to a wide list of funding options, from credit/debit card and bank wires to local payment providers and digital wallet services. The funds will usually be in your account within 12 hours and you’ll be ready to place your first trade.<br /> <br /> <a href="https://portal.thinkmarkets.com/" id="button-two">Fund your account</a><br /> <h2>Step 3 – Let’s get trading</h2> <p>Now that your account is open and funded, you can take that final step and open your first position. Here are a few pointers to help you get started:<br /> </p> <p>Remember – never place a trade that you’re not sure about. Your investment is at risk with every trade you place, so make sure you’re fully behind the decision of placing the trade before hitting the button.<br /> </p> <p> </p> <ol> <li> <p>Understand the markets – ensure you know what you want to trade and when to trade it. Our market analysis section provides plenty of market insight on a daily basis and becoming familiar with our analysts and their articles can be a helpful place to keep track of market news and trading opportunities.</p> </li> <li> <p>Know the platform – before opening your first trade we highly recommend that you become familiar with the platform of your choice. Explore the different platform features and ensure you’re comfortable with the settings before opening the order ticket for the first time. Read about our ThinkTrader® and MetaTrader 4 (MT4) platforms <a href="/en/platformoverview/">here</a></p> </li> <li> <p>Place your trade – once you’re comfortable within the platform, identify the trade you want to make and how you plan to execute it, open the order ticket, set your parameters and place the trade.</p> </li> </ol>
Ready to trade?
Ready to start your trading journey with ThinkMarkets? Apply for an account in just a matter of minutes.


