 LATAM
LATAM
Articles (23)

A Complete Guide to Japanese Candlesticks
<p>A Japanese candlestick is a technical tool used by traders to pack price information into a single candle. They are considered an extremely useful tool, since the traders are able to easily see and analyse a large amount of data.</p> <h2>Origins of the Japanese candlesticks</h2> <br /> Japanese candlesticks go back to as far as the 18th century. A Japanese trader Munehisa Homma traded rice in the local markets. He also served as an adviser to the Japanese government. <br /> <br /> Homma started recording prices of rice on a daily basis, including opening price, high, low, and close. After some time, he started noticing patterns that were repetitive.<br /> <br /> In 1755, he wrote a book titled: <br /> <br /> <br /> <strong>The Fountain of Gold — The Three Monkey Record of Mone,</strong> <br /> discussing the psychological aspects of the trading process. <br /> <br /> He is believed to be the first person to realise that the behaviour of other participants in the market is a crucial element in trading. The emotions of traders play a huge part in their decisions. Homma realised this and took advantage while trading the rice. <br /> <br /> Homma is also known for introducing the <strong>Sakata Rules</strong><br /> <br /> A set of five rules that outline patterns developed by local traders. It is exactly this set of rules that created the basis for the birth of Japanese candlesticks. <br /> <br /> It was not until the end of the previous century that Steve Nison introduced the concept of Japanese candlesticks to the wider public in a classic investing book titled:<br /> <br /> <strong>Japanese Candlestick Charting Techniques.</strong><br /> <br /> The essence of this concept is the psychology of a trader, which we will discuss in detail below.<br /> <h2>The key elements of Japanese candlesticks</h2> <p>A Japanese candlestick consists of four main elements: <br /> </p> <ul> <li>Opening price </li> <li>Highest point reached by the asset’s price</li> <li>Lowest point reached by the asset’s price</li> <li>Closing price of the candle</li> </ul> <p> </p> <p><img alt="structure of a Japanese candlestick" src="/TMXWebsite/media/TMXWebsite/structure-of-a-Japanese-candlestick-pic-2.jpg" /></p> <p> </p> <p>As seen in the photo above, the four elements create two parts of the candle: the <em>wick</em> (extending up and down) and the <em>body</em> that consists of the opening and closing prices. The wick can be long or short, depending on the price movements.<br /> <br /> As such, candlesticks differ from the simple bar charts by displaying more information, but in such a way that they are still easy to read. </p> <p> </p> <p><img alt="narrow- and wide-spread candlestick" src="/TMXWebsite/media/TMXWebsite/narrow-and-wide-spread-candlestick-pic-3.jpg" /></p> <p> </p> <p>Traders usually use either green (<em><strong>bullish</strong></em>) or red (<em><strong>bearish</strong></em>) colour to paint the candlestick, although some also use white (bullish) and black (bearish) as well.</p> <p> </p> <p><img alt="green (bullish) and red (bearish) colors" src="/TMXWebsite/media/TMXWebsite/green-(bullish)-and-red-(bearish)-colors-pic-4.jpg" /></p> <p> </p> <p>As seen in the photo above, the <strong><em>bullish candle</em></strong> is formed when the close is higher than the open, and the opposite is the case for the <em><strong>bearish candle.</strong></em> There is a wide range of different shapes, from those with long wicks to either side to those with almost no body. <br /> <br /> The top of the upper wick shows the session’s high and vice versa. The longer the distance between the high and the low, the wider the price range of the given session is. <br /> <br /> You can test how different Japanese candlestick patterns work by trading without risking your capital first, by <a href="https://portal.thinkmarkets.com/account/individual/demo"><u>opening a demo trading account</u></a>. </p> <h2>What the Japanese candlesticks tell you</h2> <p>As noted earlier, the Japanese candlesticks are important as they display data to traders that reflect the state of the market. Based on the key elements, traders can better understand the prevailing trend in the market and which side has the upper hand. <br /> <br /> Looking at the image above, we see the EUR/USD daily chart. At the right end of the chart we see a series of long and green candles. This type of candle is very strong as the body is long and the close is usually near the top of the candle. It means that the bulls are in control of the price action as they could facilitate a series of wins that brought them huge gains. <br /> <br /> A clean uptrend, which is characterised by a series of higher highs and higher lows, sends a message that there is a continuous interest from the side of buyers to push the price higher. On the other hand, the long and red candles are a sign of strong selling pressure. <br /> <br /> It is exactly the relationship between individual candlesticks that creates patterns that help traders predict future price changes. </p> <h2>The most popular candlestick patterns </h2> <p>There are two major groups of candlestick patterns: <em>bullish vs bearish</em>, and then there are <em>reversal, transitional </em>and <em>continuation</em> patterns. Patterns also differ based on the number of candles, starting from a single-candle formation to those consisting of two and three candles. <br /> <br /> Bullish patterns are those that predict that the price of an asset is likely to rise while the latter indicate the price is likely to fall. A reversal pattern signals a potential change in direction, while the continuation, as the name itself says, signals an extension of the current trend. <br /> <br /> In the section below, we will discuss the five most powerful candlestick patterns used by traders to predict price movements and make profits. All of these patterns generate a sign or message only, and you should consult other technical indicators before you engage in a trade.<br /> <br /> For this purpose, we have prepared <strong>detailed guides</strong> to explain the best candlestick patterns with examples and how to use them in your trading strategy. See a <strong>short summary</strong> for <em>the most popular ones below</em> or just <em>follow the links</em> here to the detailed guides gain deeper understanding:<br /> </p> <ul> <li><a href="~/en/trading-academy/forex/shooting-star-candlestick-pattern"><u>Shooting Star</u></a></li> <li><a href="~/en/trading-academy/forex/ascending-triangle-pattern"><u>Bullish and bearish engulfing patterns</u></a></li> </ul>

Timezones and liquidity
<h2>Forex market hours and liquidity</h2> <p>With indices, shares and most other financial products that are traded on various global exchanges, you can only make trades during the exchange’s business hours. Fortunately for forex traders, currencies are free of this restriction and can be traded day or night, with the forex market hours being open 24 hours a day, 5 days a week.</p> <h2>Capturing trading opportunities around the clock</h2> <p>Because the Forex market does not have a physical location or a central exchange, it is considered an Over-the-Counter (OTC), or "Interbank", market due to the fact that the entire market is run electronically, within a network of banks. This means that you can place trades through your broker 24 hours a day and trade at a time that’s convenient for you.</p> <p>Below you can see a 24 hour period which shows the active trading sessions of the Interbank and Retail FX markets, using London as the time zone as this is the central hub to Forex trading.</p> <h2>Nylon session</h2> <p>The highest volume of trading activity happens during the London session (as it also has Europe as well) but liquidity is at its highest when New York opens and overlaps with the London session. This is referred to as the ‘Nylon’ session (New York and London) when liquidity and trading volume is at its highest. Therefore we can expect larger moves and is an ideal time to trade breakout strategies. This is a popular time for intraday traders to participate as due to the higher volume and liquidity, spreads are at their tightest so transaction costs for the traders is lower.<br /> <br /> <img alt="timezones" src="~/TMXWebsite/media/TMXWebsite/timezones_1.png" /><br /> <br /> </p> <h2>Asia Session</h2> <p>Whilst New York and London are considered important trading centres the same can also be said for Tokyo, Hong Kong and Singapore. As London and New York banks close their official trading sessions, the Asian banks open and trade which is why Forex is seen as a 24 hour market. However the volume is not as high as the Nylon session which means we tend to see smaller price movements and wider spreads.<br /> </p> <h2>24-liquidity cycle</h2> <p>The visually show you the changes in liquidity around a 24 hour period the chart below has a 14 period ATR indicator (Average True Range). This is a proxy for volume and each horizontal line represents 24hrs. We can see that during the Asian session volume and liquidity is at its lowest and increases when Europe and London opens, with the peak during the Nylon session. Whilst it is not precise to the hour or minute I hope this demonstrates the daily cycle of increasing and decreasing volume.<br /> <br /> <br /> <img alt="timezones" src="~/TMXWebsite/media/TMXWebsite/timezones_2.png" /><br /> <br /> </p>
What are bullish and bearish Flag patterns?
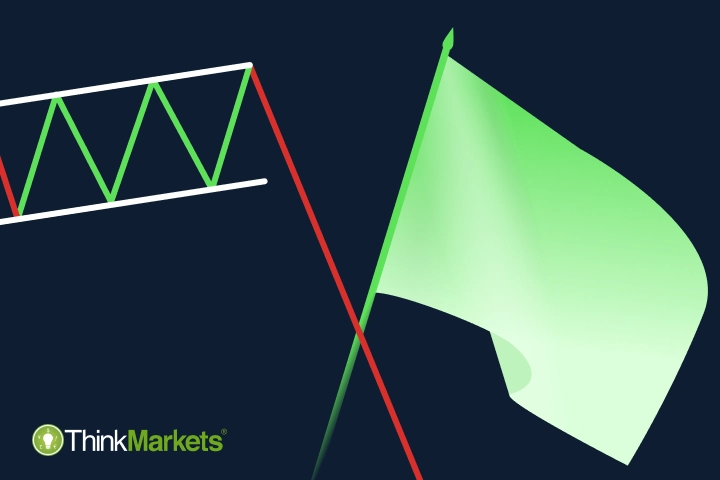
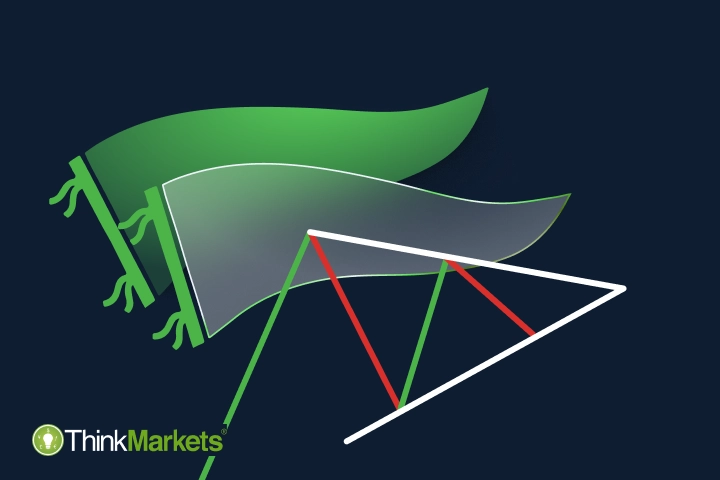
<p paraeid="{a93e94ed-6fea-4c9f-a350-f7bc6677a4d1}{52}" paraid="1878194966">Multi-candle chart patterns work roughly the same way as one-, two- and three-candle formations covered in previous articles. However, these formations don’t have a defined number of candles and serve as an indication of either continuation of the preceding trend or its reversal. </p> <p paraeid="{a93e94ed-6fea-4c9f-a350-f7bc6677a4d1}{100}" paraid="120959535">Bullish and bearish flags are continuation candlestick patterns that suggest that the current trend will resume after a short consolidation period. </p> <h2 aria-level="2" paraeid="{a93e94ed-6fea-4c9f-a350-f7bc6677a4d1}{112}" paraid="424967598" role="heading">Bullish flag chart pattern structure </h2> <p paraeid="{a93e94ed-6fea-4c9f-a350-f7bc6677a4d1}{118}" paraid="1431684069">As the name suggests, a bullish flag looks like a flag on a pole. <br /> <br /> <img alt="A graphical representation of a bullish flag pattern with a clear upward pole, followed by a consolidation zone and an upward breakout." src="~/getmedia/28d51a80-4048-4363-b2ef-3caeb2d92d3d/bullish-and-bearish-Flag-patterns.png" /><br /> <br /> </p> <p paraeid="{a93e94ed-6fea-4c9f-a350-f7bc6677a4d1}{151}" paraid="931113550">This pattern consists of a distinct pole comprising several candlesticks, a body in the opposite direction of the main trend and a breakout. To be considered a bullish flag, this formation needs to have the following characteristics: <br /> </p> <ul> <li paraeid="{a93e94ed-6fea-4c9f-a350-f7bc6677a4d1}{169}" paraid="1688653454">The “flagpole” is strongly bullish, with higher highs and higher lows; </li> <li paraeid="{a93e94ed-6fea-4c9f-a350-f7bc6677a4d1}{197}" paraid="2019845239">The “flag” is made up of candles with lower highs and lower lows that take place between two strictly parallel trend lines; </li> <li paraeid="{a93e94ed-6fea-4c9f-a350-f7bc6677a4d1}{216}" paraid="620551649">A breakout pierces the top line, resistance. </li> </ul> <h2 aria-level="2" paraeid="{a93e94ed-6fea-4c9f-a350-f7bc6677a4d1}{223}" paraid="266399962" role="heading">Bearish flag chart pattern structure </h2> <p paraeid="{a93e94ed-6fea-4c9f-a350-f7bc6677a4d1}{229}" paraid="1408549199">A bearish flag has exactly the same structure but upside down – a descending pole, an upward-facing flag and a breakout at the bottom. <br /> <br /> <img alt="Bear flag pattern" src="~/getmedia/4dc5c5f8-956f-48a4-b982-bbf7008cc76f/Bear-flag-pattern.png" /><br /> <br /> </p> <p paraeid="{64733bf8-a523-4804-8c65-248371739895}{3}" paraid="1799856450">Similar to a bullish flag, a bearish version needs to follow certain characteristics to be considered a valid chart pattern: <br /> </p> <ul> <li paraeid="{64733bf8-a523-4804-8c65-248371739895}{15}" paraid="1789624376">A strongly bearish pole with lower highs and lower lows; </li> <li paraeid="{64733bf8-a523-4804-8c65-248371739895}{22}" paraid="1336922437">A bullish series of candlesticks with higher highs and higher lows between two parallel trend lines; </li> <li paraeid="{64733bf8-a523-4804-8c65-248371739895}{38}" paraid="59528530">A breakout through support – the lower line, in the flag. </li> </ul> <h2 aria-level="2" paraeid="{64733bf8-a523-4804-8c65-248371739895}{60}" paraid="1886371726" role="heading">How do flag chart patterns work? </h2> <p paraeid="{64733bf8-a523-4804-8c65-248371739895}{66}" paraid="1274548335">Both bullish and bearish flags indicate that the prevailing power is strong to form a trend. At some point, the opposing power gains enough control to try and push the price in the opposite direction from the main trend. However, it is not strong enough to reverse the trend, so the price starts trading mostly sideways. This allows the dominant power to consolidate their efforts and push the price into a breakout, continuing the main trend. </p> <h2 aria-level="2" paraeid="{64733bf8-a523-4804-8c65-248371739895}{84}" paraid="86664609" role="heading">How to trade with Flag chart patterns </h2> <p paraeid="{64733bf8-a523-4804-8c65-248371739895}{90}" paraid="2133208689">Like with any other candlestick pattern, a rule of thumb is to wait for it to be completed and only then enter the market. </p> <h3 aria-level="3" paraeid="{64733bf8-a523-4804-8c65-248371739895}{110}" paraid="1221579474" role="heading">Trading with a bullish flag pattern </h3> <p paraeid="{64733bf8-a523-4804-8c65-248371739895}{116}" paraid="1452446115">As a bullish flag is a bullish continuation pattern appearing in an uptrend, it suggests opening a long trade once the breakout occurs.<br /> </p> <p paraeid="{64733bf8-a523-4804-8c65-248371739895}{128}" paraid="1353678010">The most common way of placing a position when trading with this pattern is to use the closing price of the breakout candle as an entry level. Stop loss can be placed at any point in the body, as any movement within it would invalidate the pattern and indicate that it’s better to exit the market. To determine a suitable take-profit level, traders commonly calculate the price change from the flagpole's base to its peak and then add this measurement to the breakout point.<br /> </p> <p paraeid="{64733bf8-a523-4804-8c65-248371739895}{166}" paraid="1990545706">Keep in mind that this scenario may be a better fit for risk-prone traders who choose to not wait for additional candles to close after the breakout, confirming the trend. If you decide to wait a little longer, the entry, stop-loss and take-profit levels may be different and need to be identified individually.<br /> </p> <p paraeid="{64733bf8-a523-4804-8c65-248371739895}{188}" paraid="1425264249">On the image below, you can see that there was a small pushback from bears, and the second candle after the breakout is bullish. However, the price shot higher right after it, validating the pattern’s suggestion. <br /> <br /> <img alt="An example of trading financial markets with a bullish Flag pattern" src="~/getmedia/f0a28f21-908e-49eb-b62d-49547334b7e5/An-example-of-trading-financial-markets-with-a-bullish-Flag-pattern.png" /><br /> <br /> </p> <h3 aria-level="3" paraeid="{64733bf8-a523-4804-8c65-248371739895}{217}" paraid="2059315071" role="heading">Trading with a bearish flag pattern </h3> <p paraeid="{64733bf8-a523-4804-8c65-248371739895}{223}" paraid="551449548">The appearance of a bearish flag in a downtrend suggests going short once the pattern is confirmed. Following the same logic, the closing price of a breakout candle can serve as an entry level.<br /> </p> <p paraeid="{64733bf8-a523-4804-8c65-248371739895}{229}" paraid="950932932">However, as you can see on the image below, a continuation of a trend indicated by a bearish flag can be short-lived. Shortly after the breakout, the price started moving sideways, eventually reversing into an uptrend. <br /> <br /> <img alt="An example of trading financial markets with a bearish Flag pattern" src="~/getmedia/cfe88a51-3394-4aa8-ba27-60e03aa3d933/An-example-of-trading-financial-markets-with-a-bearish-Flag-pattern.png" /><br /> <br /> </p> <p paraeid="{64733bf8-a523-4804-8c65-248371739895}{246}" paraid="379789178">To decrease the risk of false signals when trading with chart patterns, it is essential to gather additional insights from the price chart.<br /> </p> <p paraeid="{4b648553-9ecc-4fa5-8c8e-d32926d71f8e}{5}" paraid="151789271">In the example above, you can see that only three bearish candles formed once the breakout happened. The fourth candle was strongly bullish, forming a <a href="/trading-academy/forex/analysis/bullish-bearish-engulfing-patterns">bullish Engulfing pattern</a> and indicating a potential upcoming price reversal.<br /> </p> <p paraeid="{4b648553-9ecc-4fa5-8c8e-d32926d71f8e}{27}" paraid="732672989">Additionally, many traders use technical indicators to compare and confirm their findings, as chart patterns alone only indicate a potential outcome but do not guarantee them.<br /> </p> <p paraeid="{4b648553-9ecc-4fa5-8c8e-d32926d71f8e}{33}" paraid="954863878">Another safety measure traders should always take is trading with a risk-free <a href="https://portal.thinkmarkets.com/account/individual/demo" target="_blank">demo account</a> first to hone their skills before trading with real money. Create one now and practise trading with bullish and bearish Flag chart patterns. To learn more about chart patterns, check out our next article, where we explain how <a href="/trading-academy/forex/analysis/what-are-bullish-and-bearish-pennant-patterns">Pennant patterns</a> work. </p>
What are bullish and bearish Pennant patterns?
Pennants are another type of multi-candle chart pattern. Like <a href="/trading-academy/forex/analysis/bear-bull-flag-pattern">Flag formations</a>, bullish and bearish Pennants are continuation patterns indicating that the prevailing trend will likely continue after a brief pause. <h2>Bullish Pennant chart Pattern structure</h2> A bullish Pennant pattern has a very similar structure to a bullish Flag – a pole, a body (pennant) and a breakout. The main difference is that while the Flag’s body is made of candles trading strictly within two parallel trendlines, the Pennant’s body looks more like a triangle. <br /> <br /> <img alt="A bullish Pennant chart pattern" src="~/TMXWebsite/media/TMXWebsite/A-bullish-Pennant-chart-pattern.png" /><br /> <br /> In general, to be considered valid, bullish Pennant patterns need to have the following characteristics: <ul> <li>A bullish flagpole with higher highs and higher lows; </li> <li>A consolidation phase that takes place between the two converging trendlines;</li> <li>A breakout through the upper line.</li> </ul> <h2><br /> Bearish Pennant chart Pattern structure</h2> A bearish Pennant is a continuation pattern that resembles a bearish Flag as well, following the same logic – its body has the shape of a pennant instead of a flag. <br /> <br /> <img alt="A bearish Pennant chart pattern" src="~/TMXWebsite/media/TMXWebsite/A-bearish-Pennant-chart-pattern.png" /><br /> <br /> The main characteristics of this pattern are: <ul> <li>A strongly bearish flagpole with lower highs and lower lows; </li> <li>A relatively short body between the two converging lines; </li> <li>A breakout through the bottom line. </li> </ul> <h2>How do Pennant chart patterns work? </h2> Both bullish and bearish Pennants can show us that the dominant power on the market had enough strength to push the price in their favour and create a trend. At some point, it weakens, allowing the opposing power to test its resistance, which sends the price sideways, bouncing back and forth between the two trendlines. <br /> <br /> Eventually, the previously dominant power consolidates its efforts to resist the attempts of price reversal and pushes for the trend’s continuation. <br /> <br /> If the breakout in any of the two Pennants happens in the opposite direction invalidating the pattern, it means that the dominant power lost its ground, and the trend may reverse. <h2>How to trade with Pennant chart patterns</h2> The first step in a trading strategy with Pennants is to wait for the pattern to be completed. This means that you need to be able to identify a clear breakout – the last element of the pattern. Once you have all the elements in place – you can open a position. <h3>Trading with a bullish Pennant pattern</h3> As a bullish Pennant suggests a continuation of an upward price movement, traders usually go long once they spot this formation. <br /> <br /> On the image below, you can see a clear example of a bullish Pennant chart pattern. <br /> <br /> <img alt="Trading example with a bullish Pennant pattern" src="~/TMXWebsite/media/TMXWebsite/Trading-example-with-a-bullish-Pennant-pattern.png" /><br /> <br /> In this case, a rule of thumb for opening a position is to set the closing price of the breakout candle as an entry level and its opening price as a stop loss. However, if the opening price is just at the boundary of the breakout point, a stop should be placed slightly below this point. The general idea is that the price should not trade deeply into the pattern - if this happens, the pattern will fail, and the trader will generate a loss. <br /> <br /> For a target take-profit level, you can visually copy-paste the Pennant’s flagpole and place it at the breakout point. The end of it is where the uptrend will likely pause, stop or reverse. <br /> <br /> Risk-averse traders usually wait for one more bullish candle to close after the breakout to confirm the trend. This can mean a missed trading opportunity on the one hand, but on the other hand, it can prevent risk should the price move downward instead. The drawback with this approach is that the risk-to-reward ratio will be inferior. <h2>Trading with a bearish Pennant pattern</h2> A bearish Pennant works exactly the same way but in reverse. As a continuation chart pattern, it suggests a resumption of a downward price movement. Once the pattern is confirmed, traders tend to go short. <br /> <br /> The image below illustrates a bearish Pennant formed in a chart with a clear breakout through the bottom trendline. <br /> <br /> <img alt="Trading example with a bearish Pennant pattern" src="~/TMXWebsite/media/TMXWebsite/Trading-example-with-a-bearish-Pennant-pattern.png" /><br /> <br /> Following a trading example with a bullish Pennant, risk-prone traders can use the closing price of the breakout candle as an entry and its opening price as a stop loss. The target price, or take profit level, can be set by copy-pasting the Pennant’s flagpole to the breakout point. <br /> <br /> If you study price charts, you will notice that quite often, the price breaks in the opposite direction – through the bottom trendline in a bullish Pennant or breakout through the upper trend line in a bullish version of it. When it happens, the patterns are considered invalid, as there is no clear indication of the price direction. <br /> <br /> That’s why it’s important to keep in mind that Pennant patterns, like any other chart pattern, don’t provide a guaranteed trading signal but only a suggestion. Experienced traders use additional tools, such as one- and two-candle patterns or technical indicators, to gain additional insights into the market conditions. It is also important to note that patterns in smaller timeframes, like the 5 or even 30 minute timeframes tend to have a lower success rate compared to a pattern formed on the 4-hour or daily chart. <br /> <br /> It can also be helpful to try trading with Pennants in a risk-free demo environment first and move to trading with real money when you gain confidence in your skills. Create a demo account now and start practising. If you want to know more about chart patterns, check out our next article, where we’ll talk about a unique pattern called a Cup and handle.
Hanging Man vs Shooting Star candlestick patterns
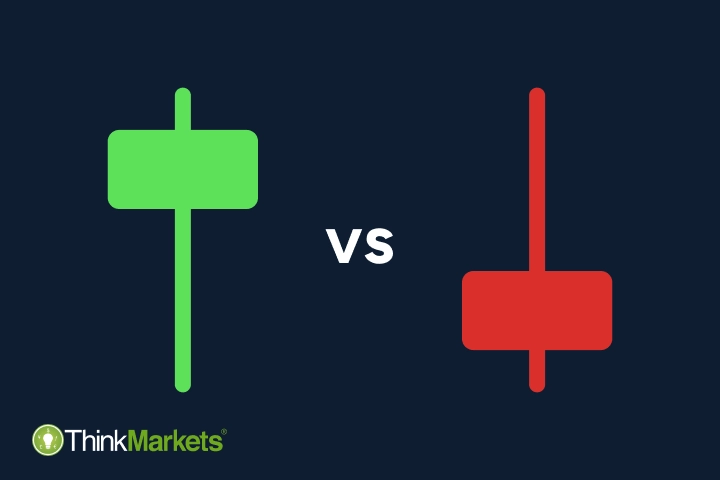
<p paraeid="{a93e94ed-6fea-4c9f-a350-f7bc6677a4d1}{52}" paraid="1878194966">The hanging man and shooting star candles are often considered a part of the hammers group, along with the hammer and inverted hammer. All four patterns are indeed very alike in their structure and are single-candle reversal chart patterns.<br /> <br /> As we mentioned in our previous article about <a href="~/en/trading-academy/forex/analysis/hammer-and-inverted-hammer-candlestick-patterns">hammer candle stick patterns</a>, the main difference is that the hanging man and shooting star appear in uptrends, while both hammers occur in a downtrend. Hence, the hanging man and shooting star patterns are considered bearish – the opposite of bullish hammers.<br /> <br /> <img alt="Hanging Man vs Shooting Star vs Hammer vs Inverted Hammer" src="~/getmedia/7bdfd60c-d229-4aa6-ade5-26a2e31a7679/Hanging-Man-vs-Shooting-Star-vs-Hammer-vs-Inverted-Hammer.png" /></p> <h2 paraeid="{a93e94ed-6fea-4c9f-a350-f7bc6677a4d1}{52}" paraid="1878194966">Hanging man candlestick pattern</h2> <br /> A Hanging man formation is the uptrend version of a hammer candlestick. Their structures are virtually the same – little to no upper shadow (wick), a small body with the high, closing and opening price close to each other and a long wick extending to the bottom. The lower wick is usually at least twice as long as the body. <br /> <br /> <img alt="Bearish and bullish Hanging Man pattern" src="~/getmedia/8c89ad4d-4b7e-43a4-bc9e-c257d070c474/Bearish-and-bullish-Hanging-Man-pattern.png" /><br /> <br /> A Hanging man candle can also be bullish (green) and bearish (red). Since this is a bearish reversal pattern, the red version of it is usually considered a stronger indication of the potential trend reversal.<br /> <h2>Shooting star candlestick pattern</h2> A shooting star candle is the uptrend version of the inverted hammer candlestick. Its short body is created by the closing, opening and high prices located near each other and a twice as long wick protruding upward. A lower shadow is usually either very short or doesn’t occur at all. <br /> <br /> <img alt="Bearish and bullish Shooting Star candlestick pattern" src="~/getmedia/a10c2061-e0ae-4a23-a28f-01798e0bd049/Bearish-and-bullish-Shooting-Star-candlestick-pattern.png" /><br /> <br /> Similar to the hanging man candle, a bearish shooting star formation is considered stronger due to the overall bearish nature of the pattern. <h2>How do hanging man and shooting star candles work?</h2> <br /> Occurring in an uptrend, both hanging man and shooting star indicate that the trend is losing its momentum, and bears are trying to overpower the bulls.<br /> <br /> The hanging man candle tells us that, although bulls still have some power that helped them to achieve a high close, bears were powerful enough to push the price much lower to create a long wick at the bottom.<br /> <br /> The shooting star pattern is considered stronger than the hanging man candle because bears managed to push the closing price to the bottom despite the long wick at the top created by bulls. <h2>How to trade with a hanging man and shooting star</h2> When a hanging man and shooting star patterns occur, traders have two options. The first option is to go short right away, using the candle’s closing price as an entry point and its high price as a stop loss. The second option is to wait for two to three candles to close and confirm a trend.<br /> <br /> There is no right or wrong decision, as it depends purely on the trader’s perception and risk appetite. However, it is important to keep in mind that neither hanging man nor shooting star candles serve as a direct trading signal. Just like any other chart pattern or technical indicator, they only suggest that a bullish trend is weakening, and price reversal may occur. It doesn’t necessarily mean that the price will reverse right after the hanging man or shooting star candle – it may take some back and forth between bulls and bears.<br /> <br /> As you can see on the image below, a shooting star was formed at the end of the uptrend. However, the price didn’t reverse immediately. It took a hanging man and some side traction for bears to assume power and turn the trend downward.<br /> <br /> <img alt="Identifying Shooting Star and Hanging Man candlestick patterns in a price chart" src="~/getmedia/c3064b11-26bb-441e-979f-6e7c8351b039/Identifying-Shooting-Star-and-Hanging-Man-candlestick-patterns-in-a-price-chart.png" /><br /> <br /> It may also be helpful to confirm the trading signal you identified with other technical analysis tools, such as <a href="/trading-academy/forex/analysis/trendline-in-technical-analysis">trendlines</a> and <a href="/trading-academy/forex/analysis/technical-indicators-beginners-guide">technical indicators</a>.<br /> <br /> Another important set of tools to use are risk management tools – stop loss and take profit. We suggest using them at all times to prevent larger than expected losses.<br /> <br /> Create a free demo account to practise identifying Hanging Man and Shooting Star candlesticks and opening positions in a risk-free environment. To discover more helpful chart patterns, head to our next article, where we will explain how a s<a href="/trading-academy/forex/analysis/spinning-top-candlestick-pattern">pinning top candle</a> works.
What is the Doji candle pattern?
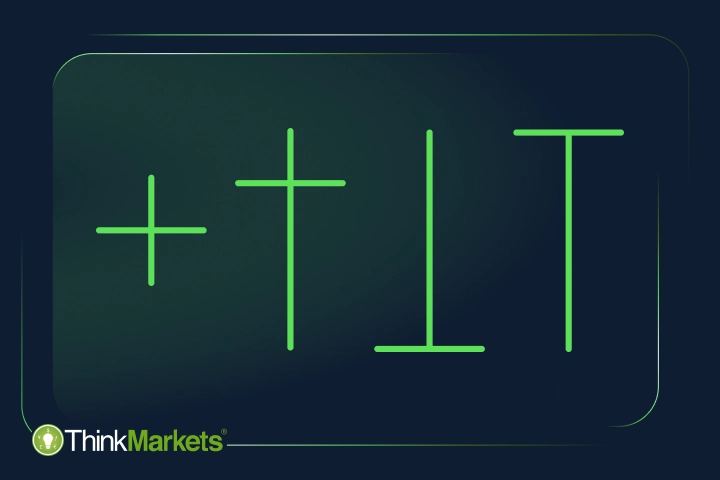
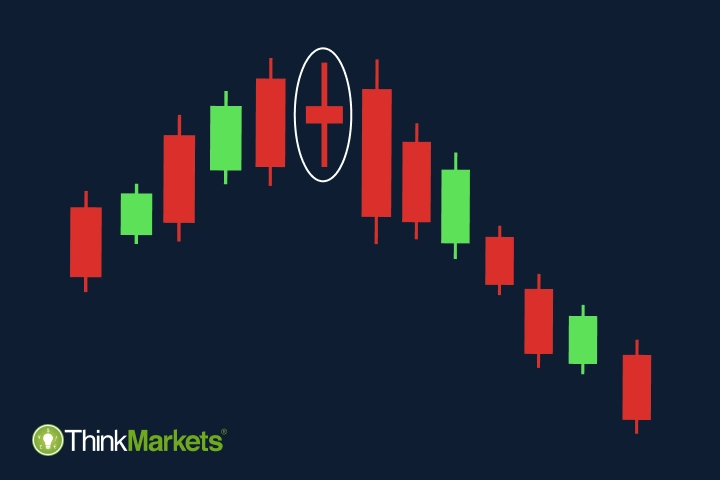
<p paraeid="{a93e94ed-6fea-4c9f-a350-f7bc6677a4d1}{52}" paraid="1878194966">A doji candlestick is a short-term pattern made of a single candle. Doji translates as “the same thing” from Japanese. It’s the perfect name for a candle that has its open and close prices at the same or almost the same level, making the body of a doji candle very small.<br /> <br /> The reason for this is the balanced power of bulls and bears, with neither being in control. Dominated by wicks, a doji candle often indicates indecision in the market.<br /> <br /> This type of candlestick can be classified as both a reversal and continuation pattern. The signal doji provides depends on the shape of a candle and its positioning within the trend.</p> <h2 paraeid="{a93e94ed-6fea-4c9f-a350-f7bc6677a4d1}{52}" paraid="1878194966">Types of doji candles</h2> Analysts distinguish five types of doji patterns:<br /> <ul> <li paraeid="{baba8067-8a56-43db-9e63-3cfb447b3ed4}{152}" paraid="2026840356">Doji Star (Neutral) </li> <li paraeid="{baba8067-8a56-43db-9e63-3cfb447b3ed4}{163}" paraid="1061156071">Four-price doji </li> <li paraeid="{baba8067-8a56-43db-9e63-3cfb447b3ed4}{174}" paraid="1506677825">Long-legged doji </li> <li paraeid="{baba8067-8a56-43db-9e63-3cfb447b3ed4}{183}" paraid="1347664177">Gravestone doji </li> <li paraeid="{baba8067-8a56-43db-9e63-3cfb447b3ed4}{190}" paraid="1797960963">Dragonfly doji </li> </ul> <h2>Doji star candlestick pattern (neutral doji)</h2> <img alt="Doji Star candle" src="~/getmedia/f06ed2c2-224a-4ec9-ad3d-d0b00f809296/Doji-Star-candle.png" /><br /> <br /> A doji star candle looks like a cross with a very short body in the middle and both wicks of similar length. This type of candlestick can occur at the end of the downtrend or in the closing stages of the uptrend. This may signal the trend weakening and a potential upcoming reversal. <h2>Four-price doji</h2> <img alt="Four-price Doji candle" src="~/getmedia/21738b3c-89de-4037-9d05-8750295aac1c/Four-price-Doji-candle.png" /><br /> <br /> The four-price doji is a very rare formation that looks like a horizontal line with high, low, opening and closing prices at the same, or nearly the same, level. This doji pattern signals very low volatility and high indecisiveness in the market. Similar to the neutral doji, the four-price doji may indicate the trend weakening. <h2>Long-legged doji candlestick pattern</h2> <img alt="Long-legged Doji candle" src="~/getmedia/540cf30b-9488-46c8-a9a6-bbe92e3e67bf/Long-legged-Doji-candle.png" /><br /> <br /> A long-legged foji, or a ‘rickshaw man’, is similar to a doji star but has longer wicks on either side. This type of candle also signals indecision as there is no clear indication about the future trend but with much higher volatility on the market.<br /> <br /> A long-legged doji candlestick formation can occur in both strong uptrends and downtrends, suggesting that the current trend may be in the closing stages, and a reversal may take place soon. <h2>Gravestone doji candlestick pattern</h2> <img alt="Gravestone Doji – a bearish reversal candlestick pattern" src="~/getmedia/e9104f26-7bfc-4b19-9cdb-0b66743c996a/Gravestone-Doji-%e2%80%93-a-bearish-reversal-candlestick-pattern.png" /><br /> <br /> A gravestone doji candle has a very long upper wick and a considerably shorter lower wick, with the candle’s body located close to the bottom.<br /> <br /> It is a bearish reversal pattern that often takes place at the end of the uptrend. The gravestone doji suggests that the bulls have pushed the price higher but could not force a close near the candle’s high price. As a result, the bears were able to return the price lower, bringing the open, close, and low prices to almost the same level, which may indicate the impending reversal of the price direction.<br /> <br /> On the other hand, when found in the downtrend, the gravestone doji may indicate its continuation. <h2>Dragonfly doji candlestick pattern</h2> <img alt="Dragonfly Doji – a bullish reversal candlestick chart pattern" src="~/getmedia/630b1b89-7ccc-4496-aa66-0af48ad588de/Dragonfly-Doji-%e2%80%93-a-bullish-reversal-candlestick-chart-pattern.png" /><br /> <br /> A dragonfly doji candlestick formation is the opposite of a gravestone doji.<br /> <br /> It’s a bullish signal with a very long lower wick, a much shorter upper wick, and the body located closer to the top. Thus, in a dragonfly doji candle, the open, high, and close prices are all very close to each other.<br /> <br /> This type of candle can occur in both uptrend and downtrend, but it is considered to be stronger when it takes place at the bottom of the downtrend and often suggests an upcoming price reversal.<br /> Found in the uptrend, a dragonfly doji may indicate its continuation. <h2>How to trade with the doji candlestick</h2> The doji candle alone is usually not strong enough to provide a definitive trading signal, so it is often used in combination with other technical analysis tools to support the findings.<br /> <br /> Support and resistance level are some of the most commonly used tools with a doji candle. For example, on the image below, you can see a gravestone doji that closed near the resistance level of the uptrend. It means that the higher price was rejected, and bears pushed the price to stay within the trend channel. Since bears had slightly more control over the market, they kept pushing the price down, causing the trend to change its direction.<br /> <br /> <img alt="Trading with a Doji candle and support and resistance levels" src="~/getmedia/9c17bd9d-3e86-49de-8426-f5a9874cf14e/Trading-with-a-Doji-candle-and-support-and-resistance-levels.png" /><br /> <br /> Another way to trade with a doji candle is to spot two consecutive doji candles, which usually means even greater indecisiveness on the market. When two candles appear one after another in a trend channel, it often results in a trend reversal. <br /> <br /> <img alt="Trading with a double Doji candle" src="~/getmedia/e1a02e93-7d33-4bdc-b100-5b9b7338f7cb/Trading-with-a-double-Doji-candle.png" /><br /> <br /> One more popular method of trading with a doji candle is to use it with the RSI oscillator. As you can see on the image below, doji candles appeared in the uptrend, signalling indecisiveness. At the same time, RSI suggests the instrument is overbought. These two factors resulted in the trend reversal. <br /> <br /> <img alt="Trading with a Doji candlestick and RSI indicator" src="~/getmedia/ad2dabe0-1248-4e82-af28-d691c091705e/Trading-with-a-Doji-candlestick-and-RSI-indicator.png" /><br /> <br /> These are just a few examples of potential positions with doji candles. Keep in mind that the appearance of these candlestick patterns does not guarantee trend reversal or continuation – it is merely an indication. That’s why using risk management tools is crucial to prevent unexpected losses should the market move in the opposite direction of your prediction.<br /> <br /> Create a demo account to practise trading with doji candles, stop loss and take profit. Ready for more technical analysis tools? Move to our next article, where we explain how the <a href="hammer-and-inverted-hammer-candlestick-patterns">hammer and inverted hammer chart patterns work</a>.
What is the Marubozu candlestick pattern?
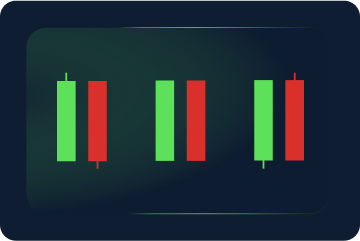
<h2 paraeid="{a93e94ed-6fea-4c9f-a350-f7bc6677a4d1}{52}" paraid="1878194966">Marubozu candlestick structure</h2> A Marubozu candle is very easy to spot because of its prominent structure. A candle consists of a long body created by a big gap between the opening and closing price and a very short wick on either side or no wicks at all. <br /> Depending on the presence and location of a wick, analysts define three types of Marubozu candles: <br /> <br /> <img alt="Marubozu candle patterns" src="~/getmedia/c3c4ac1e-313d-4c9d-99f8-06d7a5f36964/Marubozu-candle-patterns.png" /><br /> <br /> In all three cases, this candle has bullish and bearish versions. <br /> <br /> In general, for a pattern to be classified as a Marubozu candlestick formation, at least one of its wicks has to be missing. In the bullish Marubozu Full, for example, the opening price is the lowest level, and the closing price is the highest price of the candle. This means that the instrument’s price opens the session, starts rallying in a certain direction and closes at the exact end. Thus, open and close are at the same price as the high and low. <br /> <br /> As for the bullish Marubozu Open, the opening price is also the session low, indicating that buyers took control from the very start of the trading session. However, the closing price on the other side of the body can slightly differ from the high/low, leaving some room for a short wick. <br /> <br /> The Marubozu Close candle is the opposite version of the Marubozu Open. <h2>How does a Marubozu pattern work?</h2> Marubozu candle patterns send a powerful message – the market is moving in one direction. This applies to Marubozu Open and Close candles, too, despite their small wicks, as buying or selling pressure was so strong that it overwhelmed the other side of the market. <br /> <br /> In general, bearish Marubozu candles signal that the sellers are in full control as they dominated the session in the desired direction, and vice versa for the bullish Marubozu candles. <h2>How to trade with a Marubozu candlestick pattern</h2> The rule of thumb with Marubozu candles is to trade in the direction of a candle. It is generally considered a continuation pattern, but due to the length of its body, continuation implies following the direction of the candle itself, not necessarily the trend's direction. <h2>How to trade with a bullish Marubozu</h2> For example, in the price chart below, you can see a bullish Marubozu Open candlestick in action.<br /> <br /> <img alt="a bullish Marubozu" src="~/getmedia/ae326ae9-a8d9-48f8-8760-2fda6d6e4ed2/a-bullish-Marubozu.png" /><br /> <br /> After a downtrend, the price movements consolidated into trading sideways with short-term highs and lows. At one point, bulls took charge by pushing the price higher, creating a Marubozu Open candle. <br /> <br /> This means that bulls controlled the market from the candle’s opening price to the closing. Following such a strong bullish signal, the trend continued moving upward. <h2>How to trade with a bearish Marubozu</h2> On the second image, you can see the opposite scenario. A long bearish Marubozu candle was formed in an uptrend, leading to its reversal. The candle indicated that bears gained control, and the market started forming new lows and lower highs.<br /> <br /> <img alt="a bearish Marubozu" src="~/getmedia/f428c190-f8e8-41ff-996f-1cc110439790/a-bearish-Marubozu.png" /><br /> <br /> However, in both trading charts, you can see other Marubozu candles and where the market didn’t follow their directions. It happens because this pattern is not as precise as some other Japanese candlestick patterns. Moreover, it only confirms the fact that there is never a guaranteed outcome in the financial markets and all technical analysis tools provide only a suggestion. That’s why professional traders use several tools to combine their findings and make informed decisions.<br /> <br /> For example, support and resistance levels can be very helpful when you trade with a Marubozu candle. If a candle closes right before one of those levels, the price will likely bounce off and move in the opposite direction – away from the level. <br /> <br /> In some cases, a Marubozu candle opens at a support/resistance level, crosses it and closes on the other side. This means that bears/bulls were strong enough to break through an earlier established barrier and may indicate a stronger suggestion to trade in the direction of the candle.<br /> <br /> It is also very important to place a stop loss according to your risk appetite. Many traders have their stop loss at the candle’s opening or closing price depending on if trading the bullish or bearish pattern. Create a free demo account today and try finding Marubozu candles on the charts. Learn how you can use technical analysis and risk management tools in a risk-free trading environment with ThinkMarkets. To learn more about candlestick patterns, check out our next article, where we explain how <a href="/trading-academy/forex/analysis/tweezer-top-bottom-candlesticks">Tweezer candles</a> work.
What is a Spinning Top candlestick pattern?
<p paraeid="{a93e94ed-6fea-4c9f-a350-f7bc6677a4d1}{52}" paraid="1878194966">A Spinning Top is another common candlestick pattern that indicates indecisiveness on the market. Similar to a <a href="/trading-academy/forex/analysis/doji-candlestick-pattern">Doji candle</a>, a Spinning Top is a single-candle formation that is considered a neutral pattern, although appearing at the end of a trend, many end in reversals.<br /> <br /> Due to its conflicting nature, a Spinning Top candle alone is not considered a strong trading signal. However, this pattern is much stronger in a trending market, whether uptrend or downtrend. When it takes place in a sideways trend, it can be seen as another signal that there is no clarity in the price action.</p> <h2 paraeid="{a93e94ed-6fea-4c9f-a350-f7bc6677a4d1}{52}" paraid="1878194966">Spinning Top candlestick structure</h2> A Spinning Top candle is formed by a short body in the middle and two long wicks on both sides of it. Ideally, these two wicks should be of similar length, and the difference between the opening and closing prices is very small.<br /> <br /> <img alt="Bullish and bearish Spinning Top candlestick chart patterns" src="~/getmedia/7260dcfb-14c9-4ef9-9b53-c04cb6f327d8/Bullish-and-bearish-Spinning-Top-candlestick-chart-patterns.png" /><br /> <br /> Because the Spinning Top is considered a neutral pattern, neither the bullish (green) nor bearish (red) version of it is particularly stronger than the other one. As with almost all candlestick patterns, the role of the next candle is important.<br /> <br /> A reversal may happen if the next candle after the Spinning Top opposes the current trend. On the other hand, a candle that goes in the same direction as a trend may signal its continuation. <h2>Doji vs Spinning Top candlestick patterns</h2> The shape of the Spinning Top candle is very similar to a Doji candlestick pattern. Both have wicks that extend higher and lower and are considered neutral patterns.<br /> <br /> <img alt="Doji candles vs Spinning Top candles" src="~/getmedia/421a31a0-fcf8-40f9-a836-306d541acecf/Doji-candles-vs-Spinning-Top-candles.png" /><br /> However, Doji candles have a shorter wick and no, or almost no body. Spinning tops have longer wicks extending to both sides, while the body is also longer, although still short. <h2>How does a Spinning Top candle work?</h2> A Spinning Top candlestick pattern forms when the price moves in one direction and then aggressively reverses in the opposite one. At the end of the candle's timeframe, both sides settle for a draw as the closing price appears near the opening price. This means neither bulls nor bears have the upper hand on the market. Both powers are strong enough to push the price higher and lower, but neither could force a close on their side. That’s why it is classified as a neutral pattern.<br /> <br /> At the same time, in a strong uptrend or downtrend, the Spinning Top shows that there is a new balance of forces, where the opposite side of the prevailing trend is gaining more control. This indicates that the short-term outcome is uncertain, and the trend may weaken. <h2>How to trade with a Spinning Top pattern</h2> Like with any other candlestick pattern, a trading strategy with a Spinning Top candle depends on traders’ risk appetite. Moreover, it is also important whether they open long-term or short-term positions.<br /> <br /> For example, the image below shows that the downtrend has reversed after the Spinning Top candle appeared. However, it didn’t happen right away. The first candle after the Spinning Top was strongly bearish, and many traders could have considered it a trend continuation signal.<br /> <br /> <img alt="Trading with a Spinning Top candle" src="~/getmedia/ba322613-3865-4999-bbd5-1a8525e4f279/Trading-with-a-Spinning-Top-candle.png" /><br /> Risk-tolerant bears had a chance to capitalise on the short-term downward price movement, but in the long term, the price went upward, although with a lot of volatility on its way. That’s why a Spinning Top is considered a suggestion and not a strong entry signal.<br /> <br /> Risk-averse traders usually wait for a trend confirmation before they open a position – three higher highs and higher lows for an uptrend and three lower highs and lower lows for a downtrend. As you can see, there was no strong uptrend confirmation either, as the second candle after the Spinning Top had a lower low than the first one, indicating market volatility and indecisiveness.<br /> <br /> In such cases, adding insights provided by other technical analysis tools can help traders decide on a trading opportunity.<br /> <br /> For example, the image below illustrates a Spinning Top candle used with trendlines to find a price breakout. Moreover, because a strong uptrend preceded it, this candle indicated a trend reversal.<br /> <br /> <img alt="Spinning Top candle with trendlines in a price chart" src="~/getmedia/812d4d52-085c-492f-9d03-0ca9bcae376f/Spinning-Top-candle-with-trendlines-in-a-price-chart.png" /><br /> <br /> If you are familiar with technical indicators, they may also be handy in clarifying market signals. However, keep in mind that no technical tool provides 100% accurate trading signals, and it is important to always use risk management tools to prevent bigger than expected losses.<br /> <br /> Using a demo account proves to be helpful as well when it comes to planning a trading strategy. Create one for free and practise finding candlestick patterns and opening positions in a risk-free market environment. If you want to know more patterns, head to our next article, where we explain how <a href="/trading-academy/forex/analysis/bullish-bearish-engulfing-patterns">Engulfing candles</a> work.
Three White Soldiers and Three Black Crows candlestick patterns
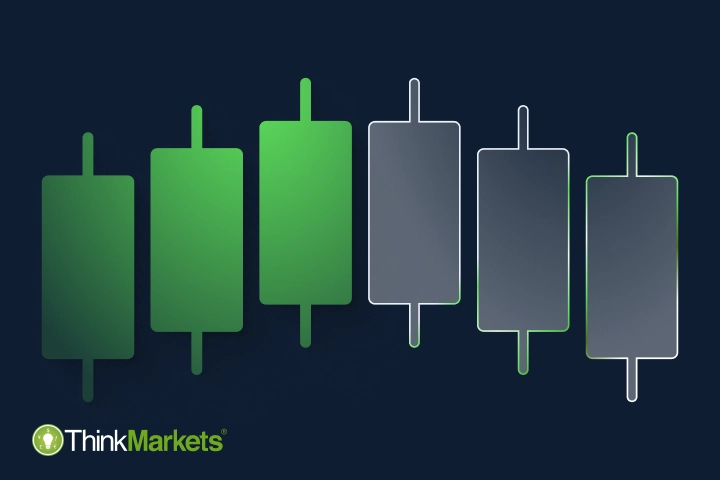
<p paraeid="{a93e94ed-6fea-4c9f-a350-f7bc6677a4d1}{52}" paraid="1878194966">The Three White Soldiers and Three Black Crows candlestick patterns are reversal patterns made of three candles, as their names suggest. Both formations indicate a potential change in the direction of a trend and are only valid when they appear after a strong uptrend or downtrend.</p> <h2 paraeid="{a93e94ed-6fea-4c9f-a350-f7bc6677a4d1}{52}" paraid="1878194966">Three White Soldiers pattern structure</h2> A Three White Soldiers is a bullish reversal pattern occurring in a strong downtrend and signals a potential upcoming change in price direction. The formation consists of three consecutive bullish candles, each opening and closing higher than the previous candle did.<br /> <br /> <img alt="A Three White Soldiers candlestick pattern" src="~/getmedia/88b2dfb8-8864-44ed-9dc0-96bd9c68d551/A-Three-White-Soldiers-candlestick-pattern.png" /><br /> All three candles may have short wicks or no wicks at all. Long wicks usually indicate that the opposing power – bears – remain strong, making the pattern less reliable. <h2>Three Black Crows pattern structure </h2> The opposite version of Three White Soldiers is called Three Black Crows. This is a bearish reversal formation, which occurs near the top of an uptrend. Like the bullish version, the Three Black Crows pattern consists of three consecutive bearish candles, preferably with long bodies. <br /> <br /> <img alt="A Three Black Crows candlestick pattern" src="~/getmedia/1d4b2a72-2aa2-4223-af17-bad129553cfb/A-Three-Black-Crows-candlestick-pattern.png" /><br /> The pattern follows the same logic as Three White Soldiers but in reverse – each candle has to open and close lower than the previous one and has no long wicks. <h2>How do Three White Soldiers and Three Black Crows patterns work?</h2> Belonging to the family of reversal patterns, the Three White Soldiers and Three Black Crows are considered powerful patterns. They occur in a strong trend when the opposing power gains more strength, pushing for a reversal.<br /> <br /> Besides indicating that the trend may change, both patterns serve as a trend confirmation themselves, as they are made of three candles in the same direction.<br /> <br /> While this is an advantage of these two patterns compared to the other reversal formations, the apparent weakness is that the three candles carry the price level far away from the recent low/high, making it more difficult to identify stop loss and take profit. <h2>How to trade with a Three White Soldiers candlestick pattern</h2> Trading with a Three White Soldiers pattern is very intuitive. All you need to do once you confirm that it’s been formed is open a position in the direction of a new trend.<br /> <br /> On the image below, you can see a price chart with a strong downtrend. At one point, bulls take control of the price and push it higher for three consecutive days, creating a strong reversal.<br /> <br /> <img alt="A trading example with a Three White Soldiers Pattern" src="~/getmedia/64c0d8d2-b1c4-4737-809a-274bbfb28103/A-trading-example-with-a-Three-White-Soldiers-Pattern.png" /><br /> To enter the market, most traders use the third candle’s closing price as a starting point. As we mentioned earlier, stop loss is quite hard to identify in this case. Risk-takers may set it at the lowest point of the first candle in the pattern, while less risky traders would choose a closer placement.<br /> <br /> Just like in any trade, higher risk often comes with higher gains but also with higher losses. On the other hand, less risky trades provide better protection from large losses but may limit trading opportunities as well. That's why it is important to assess your risk appetite before you start trading to not fall prey to your emotions.<br /> <br /> For take-profit orders, it is advisable to use support and resistance and identify the levels where the price has been stopped previously. This is why the pattern itself does not provide a take profit level. <h2>How to trade with a Three Black Crows candlestick pattern</h2> Trading with the Three Black Crows works exactly the same but in reverse. In the same chart earlier, we can see that the downtrend was created earlier by the three consecutive bearish candles.<br /> <br /> <img alt="A trading example with a Three Black Crows candlestick pattern" src="~/getmedia/3278e632-5a1d-4361-a5f9-df2603513e18/A-trading-example-with-a-Three-Black-Crows-candlestick-pattern.png" /><br /> <br /> Once this pattern was fully formed, traders had a chance to open a short position, taking the closing price at the openinging of the first candle. The take-profit level would need to be identified using something else than the pattern.<br /> <br /> You can notice that although this downtrend had a few upswings, the price never reached the opening price of the first candle's opening price. This means the swings didn't trigger the stop loss. However, if they missed the opportunity to lock their profit at the right time, it was erased by the Three White Soldiers that appeared at the end of this downtrend.<br /> <br /> As it is impossible to predict the movements of the markets with a 100% guarantee, experienced traders usually use a few additional technical analysis tools before they make a decision.<br /> <br /> On the other hand, beginners can identify the risk level they are comfortable with using a risk-free demo account. Sign up today to practise trading with chart patterns and build your trading strategy.<br /> <br /> If you’d like to know more about chart patterns, head to our next article, where we will explain how complex patterns with multiple candles, such as Flags, work.
How to trade Tweezer Bottom and Tweezer Top candlestick patterns
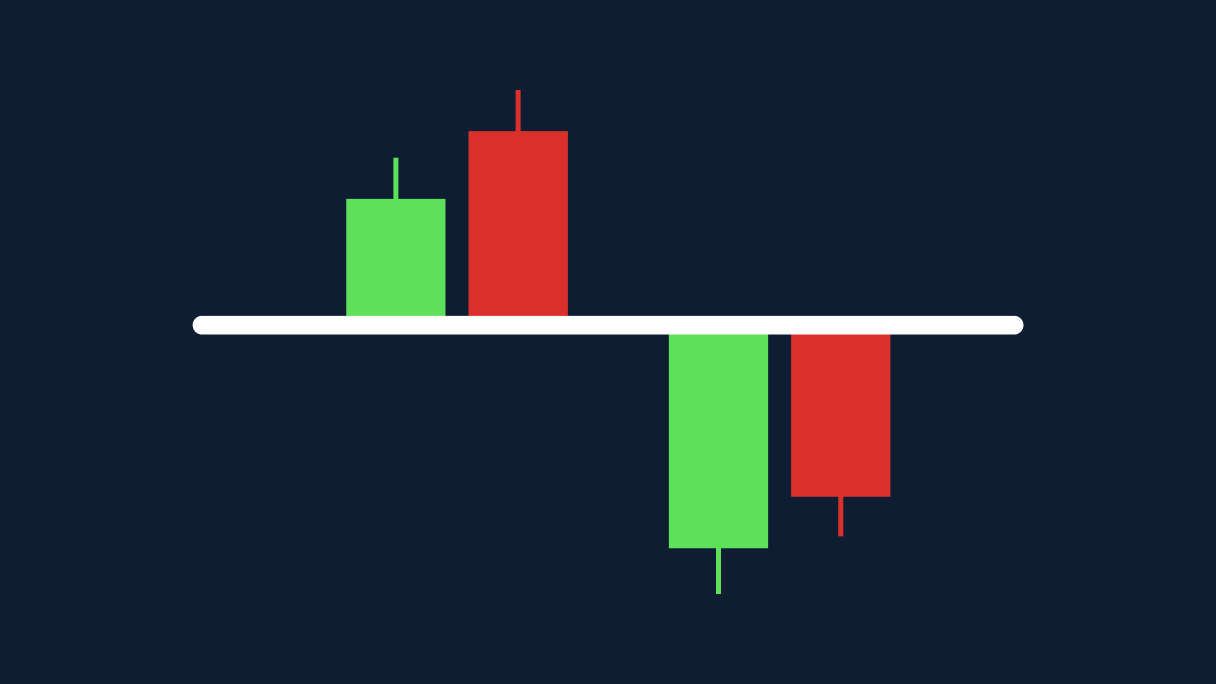
Tweezer Top and Bottom, also known as Tweezers, are reversal candlestick patterns that indicate a potential change in the price direction. Both formations consist of two candles that occur at the end of a trend, signaling its weakening. <h2>Tweezer Bottom candlestick pattern structure</h2> A Tweezer Bottom is a bullish reversal pattern that appears at the bottom of a downtrend. Both candles are of the same length but the first candle in this formation is bearish, in line with the bearish trend, while the second is bullish. <br /> <br /> The key message that this pattern signals is that despite a poor performance on the first day, the bears were not able to control the price direction as buyers were able to claw back all of their losses on the second day, which marks a deep blow for short sellers. <br /> <br /> For the pattern to qualify as a Tweezer bottom, the opening price of the new candle needs to be near the close of the prior day. The price should also not trade below the prior day’s closing price. <br /> <br /> <img alt="Tweezer Bottom candlestick pattern" src="~/TMXWebsite/media/TMXWebsite/Tweezer-Bottom-candlestick-pattern.png" /> <h2>Tweezer Top candlestick pattern structure</h2> A Tweezer Top candlestick pattern has exactly the same structure as a Tweezer Bottom but reversed. This formation occurs at the end of an uptrend, indicating potential change. Therefore, it is a bearish reversal pattern. The first candle of a Tweezer Top is bullish and continues in the same direction as the trend, while the second candle is bearish and suggests that the trend may be changing soon. <br /> <br /> <img alt="Tweezer Top candlestick pattern" src="~/TMXWebsite/media/TMXWebsite/Tweezer-Top-candlestick-pattern.png" /><br /> <br /> Similar to Tweezer Bottom, both candles should roughly match each other. However, the high prices of both candles must be approximately on the same level. <br /> <br /> Keep in mind that both Tweezer patterns are only considered valid when they occur in uptrends and downtrends. In a sideways trading market, they don’t provide any value and signal the indecision to move in either direction. <h2>How do Tweezer Bottom and Tweezer Top patterns work?</h2> As reversal patterns, Tweezers are quite popular among traders searching for clues on when the price will change its direction. This pattern can be a powerful signal of a potential upcoming reverse, as it suggests that the dominating power loses its control over the price. In turn, the opposing power gains momentum to close the session in their favour. <br /> <br /> It is important to note that the stronger (longer) the second candle is, the stronger signal this pattern generates, indicating that the opposing power had enough strength to push the closing price far from the opening. In some cases, a tweezer pattern takes the form of the <a href="/trading-academy/forex/analysis/bullish-bearish-engulfing-patterns">Engulfing</a> formation, where the second candle shuts down the first one entirely, indicating a particularly strong reversal signal. <br /> <br /> Nevertheless, just like any other candlestick pattern, neither Tweezer Bottom nor Tweezer Top guarantees market reversal and serves only as a suggestion. To help confirm their findings, traders often use additional tools. <h2>How to trade with a Tweezer Bottom candlestick pattern</h2> As noted earlier, the bullish Tweezer occurs at the bottom of a downtrend. On the image below, you can see that the instrument’s price has been moving lower for some time, creating lower highs and lower lows. <br /> <br /> <img alt="A trading example with Tweezer Bottom candlestick pattern in a chart" src="~/TMXWebsite/media/TMXWebsite/A-trading-example-with-Tweezer-Bottom-candlestick-pattern-in-a-chart.png" /><br /> If you look at the bullish Tweezer at the bottom, the first candle is a strong bearish candle that indicates the continuation of the downside move. However, the second candle surges in the opposite direction. <br /> <br /> In the following trading sessions, the bulls were able to keep pushing the price higher, completely reversing the trend, despite occasional pushbacks from bears. <br /> <br /> In this particular case, we see a very strong bullish candle that further adds to the overall bullishness of the tweezer bottom candlestick pattern. <br /> Trading the bullish Tweezer is not much different from trading other bullish reversal candlestick patterns – it is advisable to wait for the formation to be completed before entering a trade. Risk-averse traders may wait for an additional candle to close to confirm the new trade. <br /> <br /> Once you are confident that the pattern strongly indicates an upcoming reversal, you can open a long trade. The stop loss may be placed below the low point of the pattern because if the price trades below this level, it will invalidate the pattern. <h2>How to trade with a Tweezer Top candlestick pattern</h2> As you already know, unlike the bullish Tweezer Bottom, the Tweezer Top candlestick formation occurs at the top of an uptrend. Therefore, it is a bearish pattern. <br /> <br /> On the image below, you can see a strong bullish trend. A bearish Tweezer Top was formed on its top, suggesting a trend reversal. <br /> <br /> <img alt="A trading example with Tweezer Top candlestick pattern in a chart" src="~/TMXWebsite/media/TMXWebsite/A-trading-example-with-Tweezer-Top-candlestick-pattern-in-a-chart.png" /><br /> <br /> Although the second candle is slightly weaker than the first one, the uptrend still sees a strong reversal. Like with a Tweezer Bottom, traders usually open their position in the opposite direction from the main trend. In this case, it means going short, using the latest high as a stop loss. <br /> <br /> If the second candle is not strong enough to provide confidence in the upcoming reversal, you may use additional tools, such as trendlines. In the example illustration below, you can see how a crossed support line confirms the reversing trend. <br /> <br /> <img alt="Support trendline with a Tweezer Top candlestick pattern in a chart" src="~/TMXWebsite/media/TMXWebsite/Support-trendline-with-a-Tweezer-Top-candlestick-pattern-in-a-chart.png" /><br /> <br /> A great way to learn the Tweezer candlestick patterns trading is to practise identifying them in a risk-free demo account environment. Sign up today and practise opening positions with this candlestick pattern. <br /> <br /> If you want to learn more about other patterns, head to our next article, where we explain how the <a href="/trading-academy/forex/morning-evening-star-candlestick-patterns">Morning Star and Evening Star candles</a> work.
Ready to trade?
Ready to start your trading journey with ThinkMarkets? Apply for an account in just a matter of minutes.


