 Download Carl's Bear Market Survival Guide e-Book:
https://www.thinkmarkets.com/au/lp/2023-bear-market-survival-guide-ebook/
Download Carl's Bear Market Survival Guide e-Book:
https://www.thinkmarkets.com/au/lp/2023-bear-market-survival-guide-ebook/
It feels like every week is a big week in terms of economic data! Certainly, investors have been treated to a massive last few weeks – full of central bank meetings (including a few rate hikes), employment data, GDP numbers, and manufacturing and services PMIs.
Last week, we saw see-saw swings in global interest rates. Initially investors dumped long-dated debt in response to the Fitch US credit downgrade and subsequent announcement by the US Treasury’s it intends to issue around US$1 trillion worth of long-dated bonds over the next few months. This sent long-term rates spiking to post-pandemic highs. Then, investors covered back many of those shorts after a big miss in US Non-Farm Payrolls. Accordingly, the US Dollar popped, and then dropped on these gyrations.
Volatility is up, clarity is down. Enter CPI & PPI
This week's inflation data is perhaps the cherry on top of the cake for macro enthusiasts as it will either reassure the Federal Reserve it has already done enough to combat rising prices or give them cause to tighten further.
Investors would love another big beat like June’s plunge in the headline consumer price index (CPI) to just 3.0% p.a. i.e., within spitting distance of the Fed's 2% inflation target! Much of this was achieved however, by plunging energy costs. As a result, the all-important core CPI, the Fed's preferred inflation measure, fell to a stubbornly high 4.8% - albeit nicely lower than May's 5.3%.
The risk for July's data, to be released this Thursday, is we see a re-acceleration in price growth as some of the so called 'base effects' recede (i.e., the cycling out of high monthly CPI readings from 12-months ago). Also, energy commodity prices have generally been on the rise since the end of June and may well figure in the July numbers. So, this week's CPI is very much a live data point – this means there's enough uncertainty in the market about its value to ensure we could get plenty of volatility in stock, bond, and forex markets.
The all-important CPI consensus number is +0.2% for the month of July, resulting in an annual inflation rate of 3.3% (yes, that's up from June). The consensus for core, which excludes the so called 'volatile' components of food and energy, is also +0.2% for slightly lower 4.7% p.a. rate.
But wait, there's more! Friday sees the release of wholesale inflation data in the form of the Producer Price Index (PPI). It is forecasted to also have increased 0.2% month-on-month in July for core PPI, resulting in a modest 2.0% annual increase, steady on June's rate.
How to trade this week's CPI & PPI data
All things being equal, hotter US inflation equals higher US interest rates, which for us forex traders equals a strong US dollar. So, if we see a higher-than-expected CPI or PPI print, expect the US dollar to appreciate against other currencies. Conversely, if we see lower than expected readings for these data, expect the US dollar to depreciate against other currencies.
I prefer to identify a currency the US dollar has already been dominating to look for longs in should the first scenario occur, and similarly, a currency which the US dollar has been convincingly weak against to look for shorts in should the second scenario occur.
Scenario 1 – Hotter than expected inflation, Short AUDUSD
 click to enlarge chart
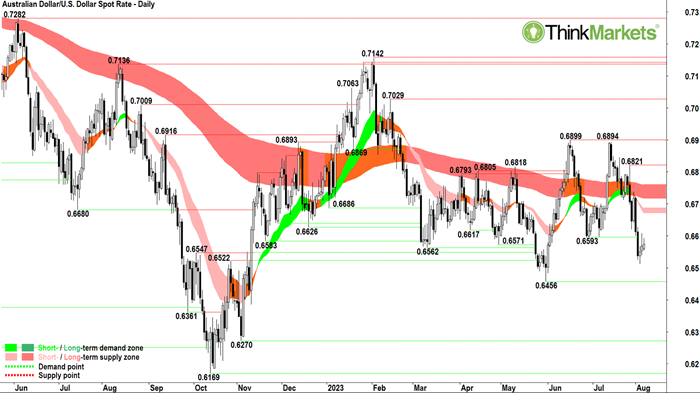
The AUDUSD chart shows the price is in a well-established short-term downtrend (light pink ribbon) and a well-established long-term downtrend (dark pink ribbon). The price action shows lower peaks and lower troughs. The candles are predominantly supply-side in nature (i.e., black bodies and/or downward pointing shadows). In combination, these technical factors demonstrate substantial excess supply for the Australian dollar versus the US dollar.
The most recent drop on 3 August breached the major point of demand set at 0.6593 on 29 June leaving just the major point of demand set at 0.6456 on 31 May as the only major barrier shielding against a deeper correction to 0.6270 (2 November 2022), or potentially even 0.6169 (31 October 2022).
0.6593 should now act as a point of excess supply for AUD vs USD, and above this, the trend ribbons should offer dynamic resistance to any upside move.
Analysts view: I am comfortable adding risk to AUDUSD shorts around the current price, or up to 0.6593 if backed by further supply-side candles. The trade is valid while the AUDUSD price continues to trade below the short-term trend ribbon.
Scenario 2 – Cooler than expected inflation, Short USDCHF
 click to enlarge chart
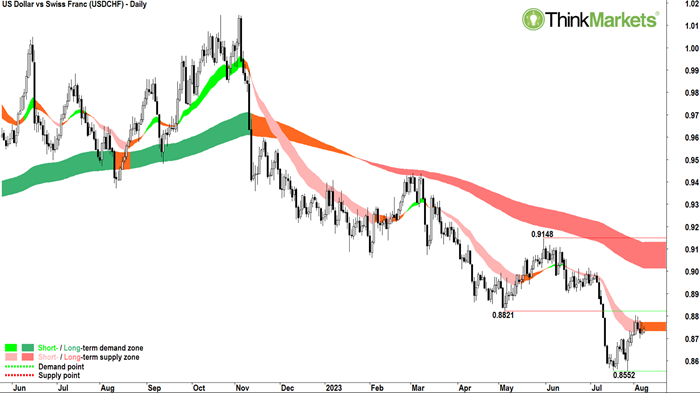
The USDCHF chart shows the price is in a well-established short-term downtrend, but the short-term downtrend is moderating (amber ribbon). It is also in a well-established long-term downtrend (dark pink ribbon). The price action shows higher peaks and higher troughs since the point of demand set at 0.8552 on 27 July. Since this time, the candles are predominantly demand-side in nature (i.e., white bodies and/or upward pointing shadows). In combination, these technical factors demonstrate short-term equilibrium in demand/supply for the US dollar versus the Swiss Franc.
0.8821 appears to be acting as a point of excess supply for USD vs CHF, and above this, short term trend is most likely to swing back to up. Short traders in the USDCHF could use this level to set stops above, for example at 0.8866 or higher.
Downside targets for short USDCHF trades are open ended once 0.8552 is breached as there is little in the way of clearly defined historical points of demand until the 2011 major swing low of 0.7070.
Analysts view: I am comfortable adding risk to USDCHF shorts up to 0.8821 if backed by clearly defined supply-side candles. The trade is valid while the USDCHF price continues to trade below 0.8866.
Learn More, Earn More!
Want your portfolio questions answered? Register for next week's Live Market Analysis sessions and attend live! You can ask me about any stock, index, commodity, forex pair, or cryptocurrency you're interested in.
REGISTER:
Live Market Analysis Webinars - Tuesdays & Thursdays 1pm, Friday 12pm AEST
You can catch the replay of the last episode of Live Market Analysis here:
Bulls aren't beaten yet! Which stocks can you Buy the Dip?