 Download Carl's Bear Market Survival Guide e-Book:
https://www.thinkmarkets.com/au/lp/2023-bear-market-survival-guide-ebook/
Forex traders love volatility, and volatility typically abounds around economic data. Well forex traders! Strap yourselves in because we're about to get massive data dump on Wednesday! More specifically, August Purchasing Managers Index (PMI) readings for Europe, the UK, and the USA.
Download Carl's Bear Market Survival Guide e-Book:
https://www.thinkmarkets.com/au/lp/2023-bear-market-survival-guide-ebook/
Forex traders love volatility, and volatility typically abounds around economic data. Well forex traders! Strap yourselves in because we're about to get massive data dump on Wednesday! More specifically, August Purchasing Managers Index (PMI) readings for Europe, the UK, and the USA.
PMI data measures the health of two main segments of an economy, manufacturing, and services. The index's author, S&P Global, surveys supply chain managers within a wide range of businesses across the major industries within a modern economy. For example, when constructing the UK PMI, S&P Global surveys approximately 650 purchasing managers, while for the European PMI its over 750, and its over 800 across 19 major industries for the US PMI. Each PMI index is weighted based upon the contribution of each industry to a country's GDP.
Survey participants are queried regarding five principal aspects: the volume of new orders, inventory levels, production output, supply deliveries for production purposes, and employment change. S&P Global assesses improvements, deteriorations, or stability in each aspect, with equal weighting applied to each area.
Both the manufacturing and services PMIs are calculated as numerical values within the range of 0 to 100. The pivotal point for equilibrium between expansion and contraction in each segment is set at 50. For instance, if the Manufacturing PMI registers at 48.5, this signifies a contraction in the manufacturing sector during the surveyed period. Conversely, if the Services PMI, for instance, reaches 56, it indicates an expansion in the services sector over the period of analysis. Readings below 50 in the lower 40s are generally indicative of weakness, while readings surpassing 60 suggest notable strength.
The significance attached to PMI data by investors is underpinned by several factors. Primarily, the data draws from a diverse array of enterprises spanning key industries in the US economy. Moreover, the manufacturing and services sectors are paramount non-governmental and non-rural domains (which are frequently influenced by seasonal factors). Lastly, the data's inherent nature is forward-looking in nature — metrics such as new orders, inventory levels, supply requisitions, and shifts in employment reflect a company's confidence in its expected profitability.
What to look for in this week's PMI data
This week's PMIs are what we call "flash" PMIs. This means they are the first preliminary readings of this data, and their values may be revised when the "final" editions are released (usually a week later).
First up is the release of the European flash PMIs on Wednesday at 07:15 GMT. Here, traders should watch for the August French Manufacturing PMI to come in steady at 49.6, and the French Services PMI to rise to 47.5 from July's 47.1. At 07:30 GMT, the more important German Manufacturing PMI is expected to show a slight improvement to 38.9 from July's 38.8 and the German Services PMI is expected to fall to 51.5 from July's 52.3.
UK PMIs are up next at 08:30 GMT. These are expected to show the UK Manufacturing sector remained in contraction with a UK Manufacturing PMI reading of 45.1, down slightly from July's 45.3, and the UK Services sector is still growing, but at a slower rate, with the UK Services PMI to come in at 50.9 versus July's 51.5.
Finally, at 01:45pm GMT, we'll get data on the US manufacturing and services sectors. The US Manufacturing PMI is expected to come in at 48.9, down from July's 49.0, and the US Services PMI is expected to come in at 52.1, down from July's 52.3.
How to trade this week's PMI data
Considering the above expectations for the various PMI data, it is clear the manufacturing sector will likely remain in contraction for another month on both sides of the Atlantic. The situation in Germany is particularly dire and is on track to drag this important European economy into another quarter of recession in the third quarter. A stronger than expected result, potentially greater than 40, would likely trigger euro strength. Conversely, a significantly weaker print, potentially closer to 36, would likely see the euro weaken against its rivals.
Similarly for the UK and US data. Stronger than expected PMI readings are going to bolster their respective currencies, whilst weaker readings will likely undermine them.
When trading economic data, I prefer to identify a currency pair which shows a strong trend correlating to strength of a currency highly influenced by the data, and a currency pair which shows a strong trend correlating to weakness in the currency. For example, if we take the euro as a base currency, which currency pair is showing the greatest euro strength? This is the pair I will look to go long the euro in the event of a stronger than expected data point. Conversely, which currency pair is showing the greatest euro weakness? This is the pair I will look to go short the euro in the event of a weaker than expected data point. Similarly for the US dollar and Pound Sterling.
Looking across the options on each of the three currencies, I have come up with my two favourite potential trades on this week's PMI data.
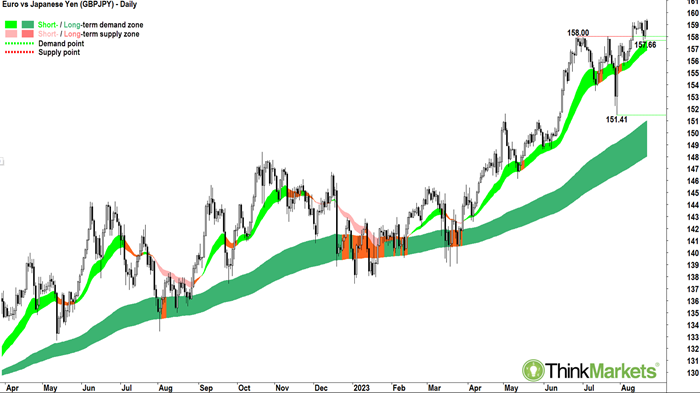
Option 1 – Stronger than expected European PMIs, Long EURJPY
 Click to enlarge chart
The EURJPY chart shows the price is in a short-term uptrend (light green ribbon) and a well-established long-term uptrend (dark green ribbon). The price action shows higher peaks and higher troughs. The candles since the 27 July swing low are predominantly demand-side in nature (i.e., white bodies and/or downward pointing shadows). In combination, these technical factors demonstrate a state of excess demand for the euro versus the Japanese yen.
Support is expected at the 28 June point of supply of 158. Previous points of supply once breached tend to act as future points of demand. I expect solid demand between 158 and down to the 18 August point of demand of 157.66. Dynamic support at the short-term trend ribbon should also be expected (approx. 157-figure). There is little in the form of historical points of supply to impede the price action in the near term, with current prices pushing to 15-year highs (July 2008 high of 170-figure next key upside target).
Analysts view: I am comfortable adding risk to EURJPY longs based upon a candle close near or above 158.49. The trade would be valid while the EURJPY price continues to trade above the short-term trend ribbon.
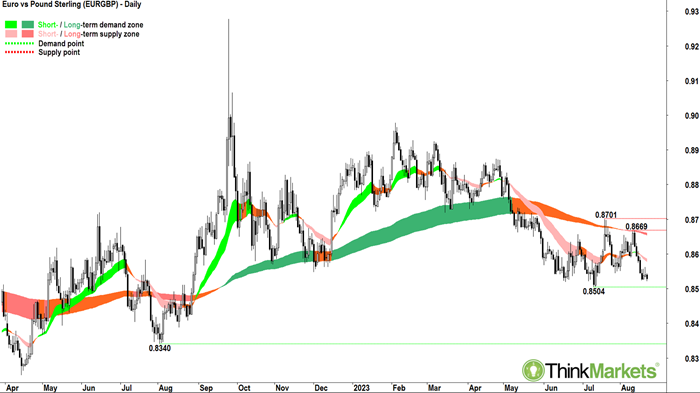
Option 2 – Weaker than expected European PMIs, Stronger than expected UK PMIs
 Click to enlarge chart
The EURGBP chart shows the price is in a well-established short-term downtrend (light pink ribbon) and a well-established long-term downtrend (dark pink ribbon). The price action shows lower peaks and lower troughs. The candles are predominantly supply-side in nature (i.e., black bodies and/or upward pointing shadows). In combination, these technical factors demonstrate substantial excess supply for the euro versus the Pound Sterling.
The key point of supply is the 11 August peak of 0.8669. Stops for potential short EURGBP trades are best set above this point. The point of demand set on 11 July at 0.8504 is the key support level. Once breached, I expect the EURGBP could target the 2 August 2022 low of 0.8340.
Analysts view: I am comfortable adding risk to EURGBP shorts around the current price, or up to the 21 August candle high of 0.8563 if backed by further supply-side candles. The trade is valid while the EURGBP price continues to trade below the short-term trend ribbon.
Learn More, Earn More!
Want your portfolio questions answered? Register for next week's Live Market Analysis sessions and attend live! You can ask me about any stock, index, commodity, forex pair, or cryptocurrency you're interested in.
REGISTER:
Live Market Analysis Webinars - Macro Wednesdays 3am UTC, USA Stocks Thursdays 2am UTC
You can catch the replay of the last episode of Live Market Analysis here:
Now is the time to protect your portfolio. Here's how.