What Do we expect from this FOMC Meeting?
The FOMC will meet this week to decide on monetary policy and to publish its economic forecasts in terms of GDP growth, inflation, and unemployment levels with the dot plot diagram showing each Fed member’s projections for the US interest rates in the coming years.
Investors expect the Fed to slow down its rate hike pace from 75 bp to 50 bp in the December meeting, taking the cash rate from 4.00% to 4.50% due to a significant fall in inflation levels in the last two months.
The US core CPI fell from 6.3% in October to 6.0% in November and the CPI headline of November printed its lower read in 2022 at 7.1% indicating that the worse of inflation has likely passed, and while the Fed members will likely welcome the deceleration as the numbers are moving in the correct direction they could maintain their hawkish tone as a weak Dollar will not be helpful in bringing the inflation rate back to its 2% target.
It is worth mentioning that the US Treasury Secretary Janet Yellen hoped that high prices would be “short-lived” due to deflationary signs including lower shipping costs and shortened lag time for deliveries.
How Long Does the Fed Policy Need to Stay Tight?
Markets and the Federal Reserve are split over how long rates will have to stay high. Despite all the Fed member’s recent hawkish rhetoric, investors have been pricing in the Fed’s tight policy in 2023 up to 5% until the start of Q2 followed by a hike pause and then a possible rate cut of 50 bp before the end of 2023.
Therefore, the US dollar index could fall to sub-100.00 levels and trade even lower in 2023 and this could boost the gold price rally.
On the other hand, investors will tune in to the Fed Chair Mr. Powell’s press conference at on Wednesday at 7:30 UK time to get more clarity about the central bank’s future monetary policy.
Chart of the Day- Gold Daily Price Chart
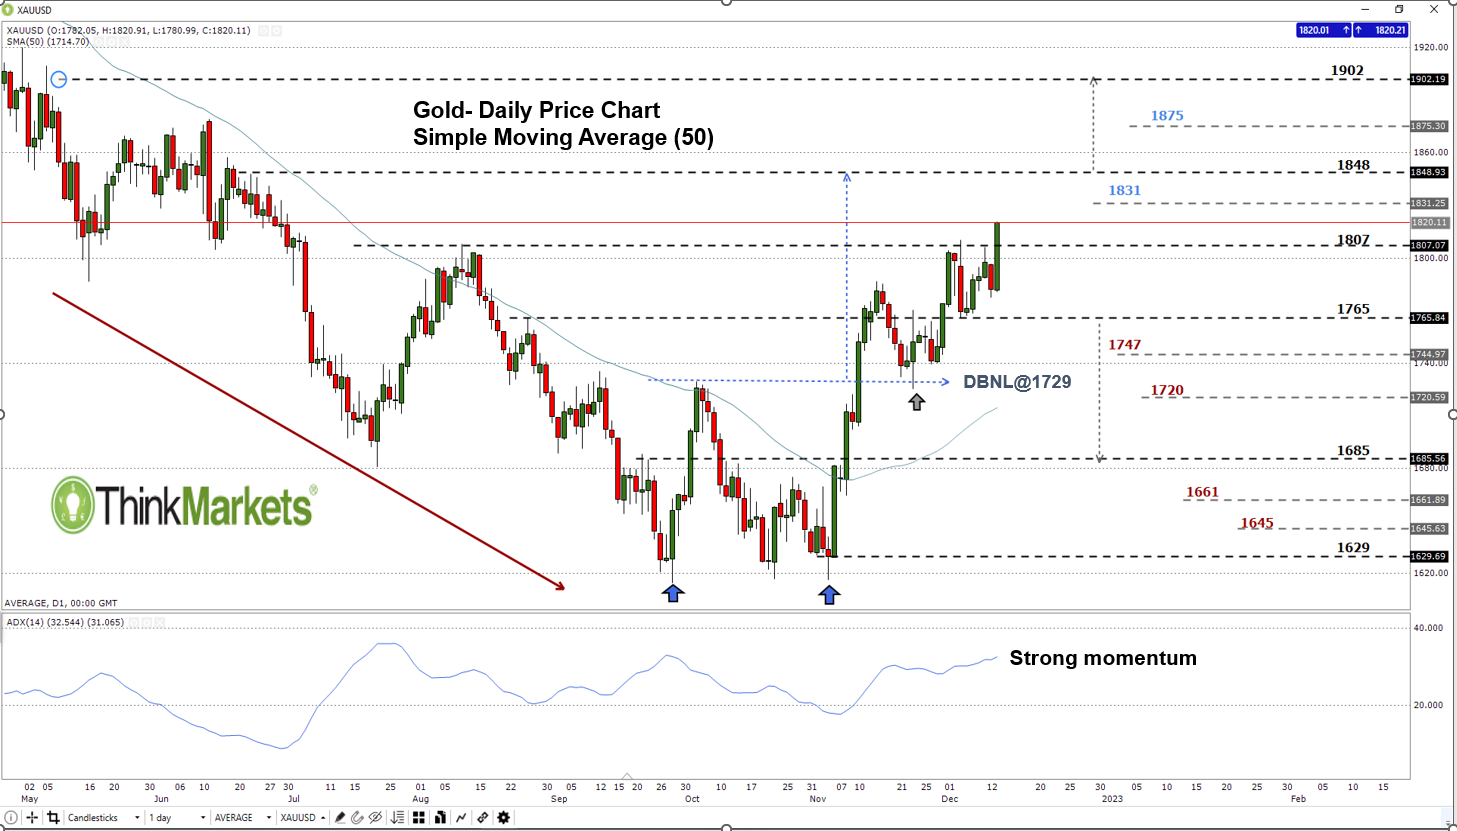
On November 10 the Gold price broke above the double bottom neckline located at 1729 and started a bullish momentum creating higher highs with higher lows and eyeing a test of $1848/oz.
Currently, the price trades in the area between 1807 – 1848. Therefore, a daily close above the high end of this area may encourage traders to press toward 1902. However, the resistance level located at 1875 should be considered. On the other hand, a daily close below 1765 may send the price even lower towards 1747 and 1720 respectively.
Any opinions, news, research, analyses, prices or other information contained on this website is provided as general market commentary and does not constitute investment advice. ThinkMarkets will not accept liability for any loss or damage including, without limitation, to any loss of profit which may arise directly or indirectly from use of or reliance on such information.

Learn and earn more today.
Visit our Education Centre