A topical look at technical analysis factors for a number of key markets, and ASX stocks of interest for 25 August.
In today's ThinkTechnical we'll take a look at the technical picture for three very prospective Exchange Traded Funds (ETF).
In its simplest sense, an ETF is a collection of investments packaged into a single instrument that can be traded on a stock exchange, such as the Australian Securities Exchange (ASX). An ETF is an open-ended investment fund, which means that the issuer may continue to issues shares based upon the current value of the assets in the fund (so an ETF can never run out of shares to offer). In many ways, ETFs are similar to traditional open-ended managed funds because:
1. As an investor in an ETF you own a proportional interest in the pooled assets of the fund;
2. The issuer of the ETF is the manager, or may appoint managers to curate the assets within the fund, and will charge a management fee for their services.
However unlike traditional managed funds, they are exchange traded, meaning that you can access your funds as quickly as you can sell them on the relevant exchange. Also, you can see your transaction price immediately - it is simply the market price of the ETF. This generally compares favourably to most managed funds which may take many days or even over a week to settle the funds resulting from a transaction, and who may use complex internal formulas to calculate the price of your transaction.
High levels of transparency in trading ETFs, in the assets held in the ETFs, and their ease of access, has led to a boom in their use globally.
So, let's have a look at Vaneck Vectors Morningstar Wide Moat Exchange Traded Fund (MOAT), Morningstar Global Technology Exchange Traded Fund (TECH), and Vanguard All-World Ex-U.S. Shares Index ETF (VEU).
Vaneck Vectors Morningstar Wide Moat Exchange Traded Fund (MOAT)
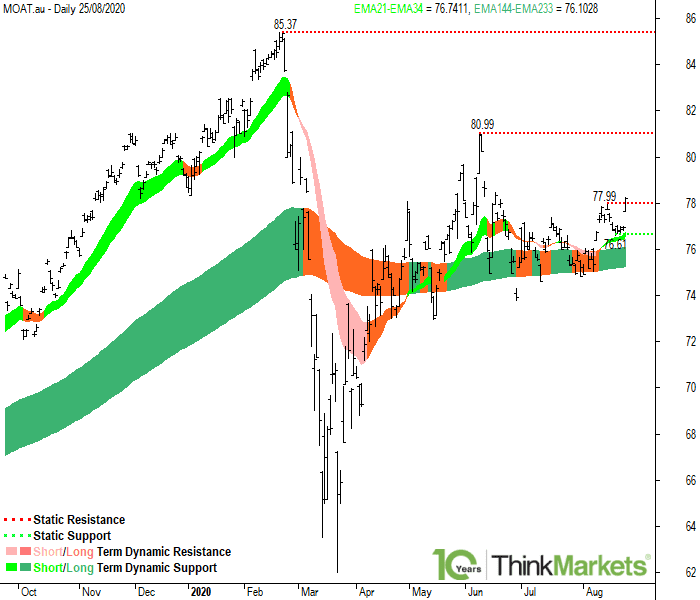
Vaneck Vectors Morningstar Wide Moat Exchange Traded Fund is in a well-defined short term uptrend, as evidenced by the 21 EMA located above the 34 EMA and with each EMA rising. The long term uptrend is also well-defined, as evidenced by the 144 EMA located above the 233 EMA and with each EMA rising.
Static resistance will be encountered at the 14 Aug 2020 high of 77.99, the 09 Jun 2020 high of 80.99, and then at the 21 Feb 2020 high of 85.37.
Static support 19 Aug 2020 low of 76.61.
The dynamic short term support zone is defined by the 21-34 EMAs, projected between 76.60 and 76.80.
The dynamic long term support zone is defined by the 21-34 EMAs, projected between 72.30 and 76.20. The price has been consistently rebounding higher out of the long term dynamic support zone since the long term uptrend began in 2016. This highlights the importance of this zone as a future area of potential dynamic long term support going forwards.
Targets are to the 21 Feb 2020 high of 85.37. Beyond 85.37, MOAT is at all-time highs, and therefore targets are open ended.
Traders may wish to buy at the static and dynamic support zones with stops set below these levels. If this cannot be achieved, then traders may have to consider buying on a breach of the 25 Aug 2020 high of 78.22.
Morningstar Global Technology Exchange Traded Fund (TECH)
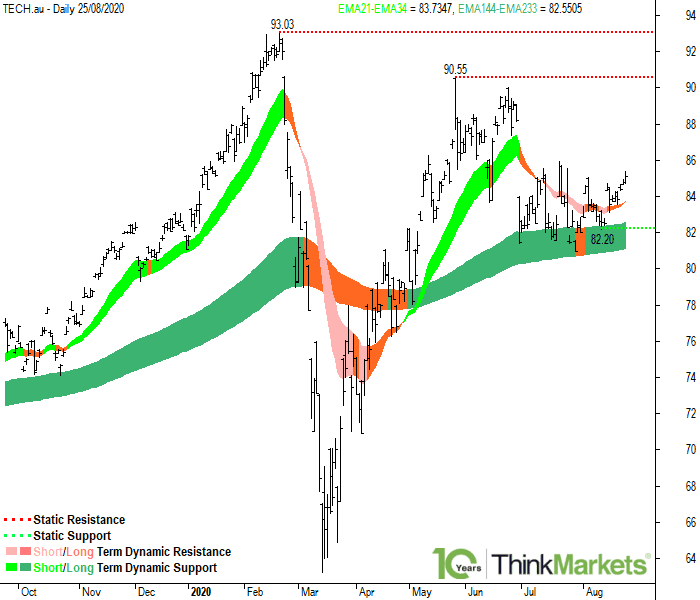
Morningstar Global Technology Exchange Traded Fund is in a well-defined short term uptrend, as evidenced by the 21 EMA located above the 34 EMA and with each EMA rising. The long term uptrend is also well-defined, as evidenced by the 144 EMA located above the 233 EMA and with each EMA rising.
Static resistance will be encountered at the 26 May 2020 high of 90.55, and then at the 20 Feb 2020 high of 93.03.
Static support 12 Aug 2020 low of 82.20.
The dynamic short term support zone is defined by the 21-34 EMAs, projected between 83.70 and 83.80.
The dynamic long term support zone is defined by the 21-34 EMAs, projected between 81.15 and 82.60. The price has been consistently rebounding higher out of the long term dynamic support zone since the long term uptrend began in 2018. This highlights the importance of this zone as a future area of potential dynamic long term support going forwards.
Targets are to the 20 Feb 2020 high of 93.03. Beyond 93.03, TECH is at all-time highs, and therefore targets are open ended.
Traders may wish to buy at the static and dynamic support zones with stops set below these levels. If this cannot be achieved, then traders may have to consider buying on a breach of the 25 Aug 2020 high of 85.34.
Vanguard All-World Ex-U.S. Shares Index ETF (VEU)
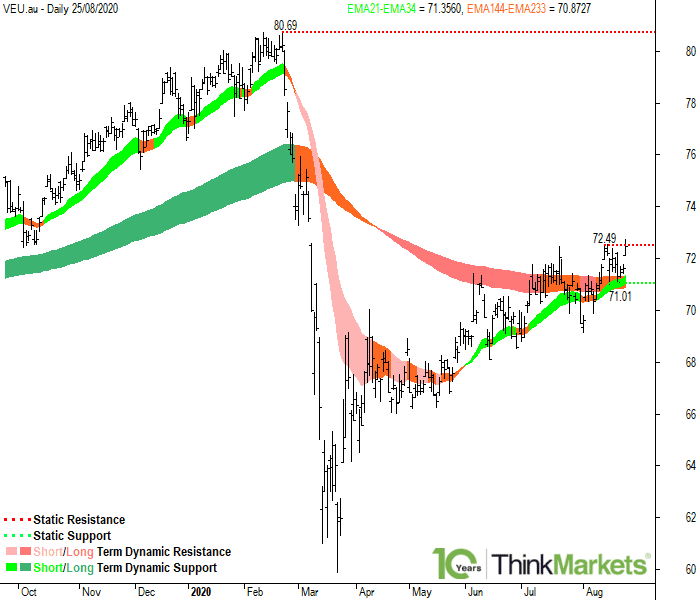
Vanguard All-World Ex-U.S. Shares Index ETF is in a well-defined short term uptrend, as evidenced by the 21 EMA located above the 34 EMA and with each EMA rising. The long term trend is undefined, as evidenced the 144 EMA located below the 233 EMA but with each EMA rising. It is likely that these EMAs cross in the near future, therefore initiating a new long term uptrend.
Static resistance will be encountered at the 13 Aug 2020 high of 72.49, and then at the 21 Feb 2020 high of 80.69.
Static support 17 Aug 2020 low of 71.01.
Note that static support at 71.01 coincides with dynamic short term support expected to be encountered in the zone defined by the 21-34 EMAs, projected between 71.00 and 71.30. Whenever multiple support factors coincide, the market response at the zone defined by these factors tends to be stronger. The price has been consistently rebounding higher out of the short term dynamic support zone since the short term uptrend began in June. This highlights the importance of this zone as a future area of potential dynamic short term support going forwards.
The dynamic long term resistance zone is defined by the 21-34 EMAs, projected between 70.90 and 71.35. The price has been consistently rebounding lower out of the long term dynamic resistance zone since the long term uptrend began in April. The key issue now, is that the price is currently trading above this zone. If this situation continues, the zone may well switch from offering dynamic long term resistance to offering dynamic long term support.
Targets are to the 21 Feb 2020 high of 80.69. Beyond 80.69, VEU is at all-time highs, and therefore targets are open ended.
Traders may wish to buy at the static and dynamic support zones with stops set below these levels. If this cannot be achieved, then traders may have to consider buying on a breach of the 25 Aug 2020 high of 72.69.