A topical look at technical analysis factors for a number of key markets, and ASX stocks of interest for 26 August.
In today's ThinkTechnical we'll take a look at the technical picture for technology companies Frontier Digital Ventures (FDV), and Integrated Research (IRI); for property developer Goodman Group (GMG); for industrial and media stock Seven Group (SVW); and for online retailer Temple & Webster Group (TPW).
Frontier Digital Ventures (FDV)
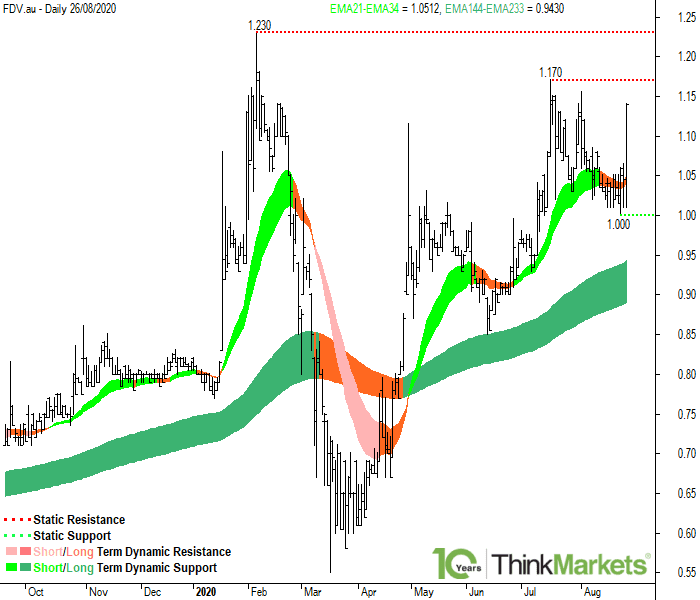
Frontier Digital Ventures is in a short term uptrend, as evidenced by the 21 EMA located above the 34 EMA. The long term uptrend is well-defined, as evidenced by the 144 EMA located above the 233 EMA and with each EMA rising.
Static resistance will be encountered at the 16 Jul 2020 high of 1.170, and then at the 06 Feb 2020 high of 1.230.
Static support will be encountered at the 24 Aug 2020 low of 1.000, which coincides with the 1.000 round number. Whenever multiple support factors coincide, the market response at the zone defined by these factors tends to be stronger.
The dynamic short term support zone is defined by the 21-34 EMAs, projected between 1.040 and 1.050. The price has been consistently rebounding higher out of the short term dynamic support zone since the short term uptrend began in May. This highlights the importance of this zone as a future area of potential dynamic short term support going forwards.
Targets are to the 06 Feb 2020 high of 1.230. Beyond 1.230, FDV is at all-time highs, and therefore targets are open ended.
Traders may wish to buy at the static and dynamic support zones with stops set below these levels. If this cannot be achieved, then traders may have to consider buying on a breach of today's current high of 1.140.
Goodman Group (GMG)
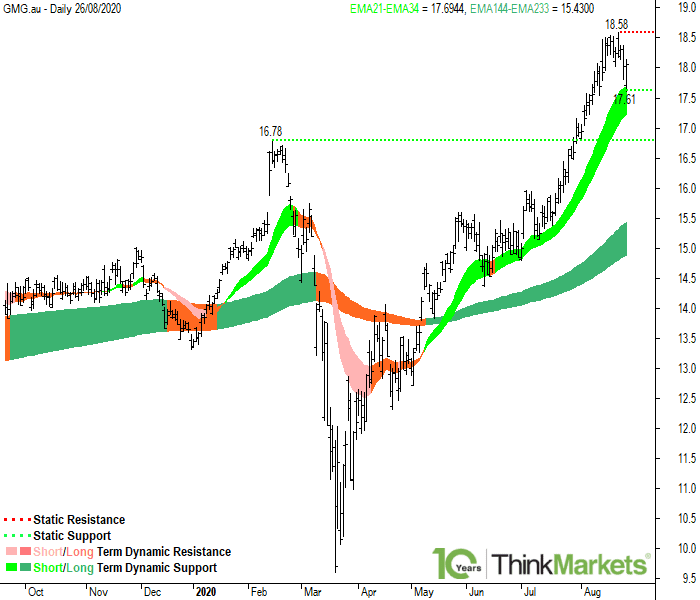
Goodman Group is in a well-defined short term uptrend, as evidenced by the 21 EMA located above the 34 EMA and with each EMA rising. The long term uptrend is also well-defined, as evidenced by the 144 EMA located above the 233 EMA and with each EMA rising.
Static resistance will be encountered at the 21 Aug 2020 high of 18.58.
Static support will be encountered at the 14 Feb 2020 low of 16.78.
Note that static support at today's low of 17.61 coincides with dynamic short term support expected to be encountered in the zone defined by the 21-34 EMAs, projected between 17.25 and 17.75. The price has been consistently rebounding higher out of the short term dynamic support zone since the short term uptrend began in May. This highlights the importance of this zone as a future area of potential dynamic short term support going forwards.
Beyond 18.58, GMG is at all-time highs, and therefore targets are open ended. Note however, static resistance is expected to be encountered at the 20.00 round number.
Traders may wish to buy at the static and dynamic support zones with stops set below these levels. If this cannot be achieved, then traders may have to consider buying on a breach of today's current high of $18.03.
Integrated Research (IRI)
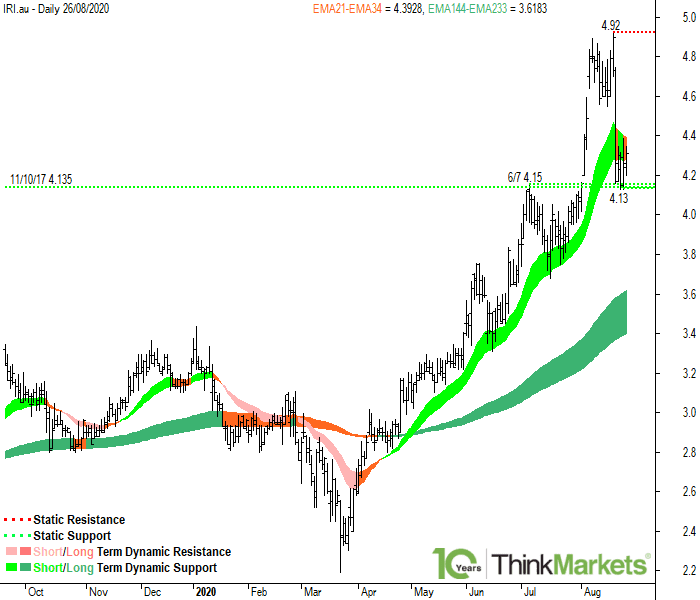
Integrated Research is in a short term uptrend, as evidenced by the 21 EMA located above the 34 EMA. The long term uptrend is well-defined, as evidenced by the 144 EMA located above the 233 EMA and with each EMA rising.
Static resistance will be encountered at the 19 Aug 2020 high of 4.92.
Static support will be encountered at the 24 Aug 2020 low of 4.13, which coincides with the 06 Jul 2020 high of 4.15, and also the 11 Oct 2017 high of 4.14. Whenever multiple support factors coincide, the market response at the zone defined by these factors tends to be stronger.
The dynamic short term support zone is defined by the 21-34 EMAs, projected between 4.30 and 4.40. The price has been consistently rebounding higher out of the short term dynamic support zone since the short term uptrend began in April. This highlights the importance of this zone as a future area of potential dynamic short term support going forwards.
Beyond 4.92, IRI is at all-time highs, and therefore targets are open ended.
Traders may wish to buy at the static and dynamic support zones with stops set below these levels. If this cannot be achieved, then traders may have to consider buying on a breach of the 25 Aug 2020 high of 4.38.
Seven Group (SVW)
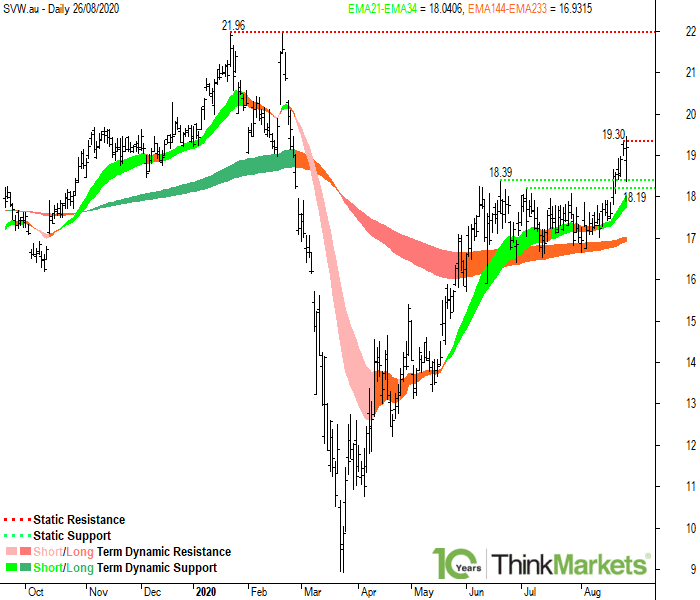
Seven Group is in a well-defined short term uptrend, as evidenced by the 21 EMA located above the 34 EMA and with each EMA rising. The long term trend is undefined, as evidenced the 144 EMA located below the 233 EMA but with each EMA rising. It is likely that these EMAs cross in the near future, therefore initiating a new long term uptrend.
Static resistance will be encountered at the 25 Aug 2020 high of 19.30, and then at the 22 Jan 2020 high of 21.96.
Static support will be encountered at the 19 Jun 2020 high of 18.39, and then at the 03 Jul 2020 high of 18.19.
The dynamic short term support zone is defined by the 21-34 EMAs, projected between 17.75 and 18.10. The price has been consistently rebounding higher out of the short term dynamic support zone since the short term uptrend began in May. This highlights the importance of this zone as a future area of potential dynamic short term support going forwards.
The dynamic long term "resistance" zone is defined by the 21-34 EMAs, projected between 16.95 and 17.05. Interestingly, the price has been consistently rebounding higher out of this zone since the long term uptrend began in late May. It is expected it will continue to provide dynamic long term support until the long term EMAs officially cross over to initiate a new long term uptrend.
Beyond 21.96, SVW has little in the way of key price action-based static resistance points to impede upside progress. Note however, static resistance is expected to be encountered at the 25.00 round number.
Traders may wish to buy at the static and dynamic support zones with stops set below these levels. If this cannot be achieved, then traders may have to consider buying on a breach of today's current high of 19.44.
Temple & Webster Group (TPW)
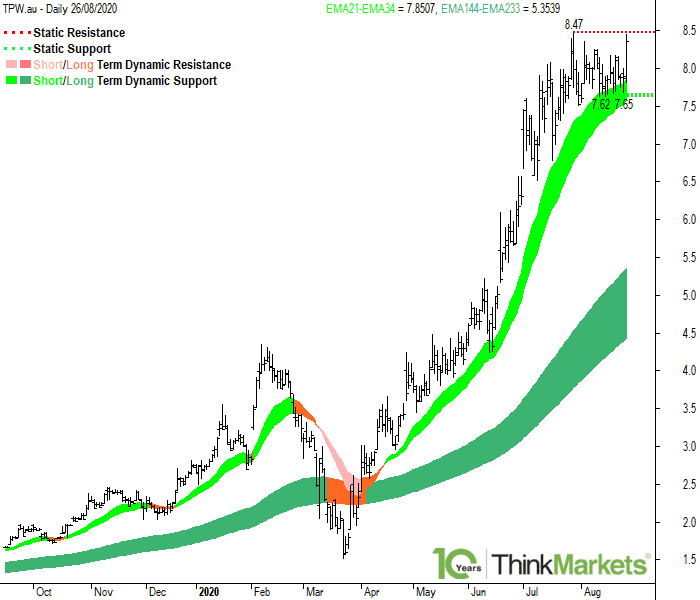
Temple & Webster Group is in a well-defined short term uptrend, as evidenced by the 21 EMA located above the 34 EMA and with each EMA rising. The long term uptrend is also well-defined, as evidenced by the 144 EMA located above the 233 EMA and with each EMA rising.
Static resistance will be encountered at the 29 Jul 2020 high of 8.47.
Static support will be encountered at the 25 Aug 2020 low of 7.65, which coincides with the 14 Aug 2020 low of 7.62. Whenever multiple support factors coincide, the market response at the zone defined by these factors tends to be stronger.
Note that static support at 7.65 coincides with dynamic short term support expected to be encountered in the zone defined by the 21-34 EMAs, projected between 7.60 and 7.90. Whenever multiple support factors coincide, the market response at the zone defined by these factors tends to be stronger. The price has been consistently rebounding higher out of the short term dynamic support zone since the short term uptrend began in April. This highlights the importance of this zone as a future area of potential dynamic short term support going forwards.
Beyond 8.47, TPW is at all-time highs, and therefore targets are open ended. Note however, static resistance is expected to be encountered at the 10.00 round number.
Traders may wish to buy at the static and dynamic support zones with stops set below these levels. If this cannot be achieved, then traders may have to consider buying on a breach of 8.47.