A topical look at technical analysis factors for a number of key markets, and ASX stocks of interest for 27 August.
A bumper edition of ThinkTechnical today. Basically, if a company's chart meets the criteria - it goes in.
So, on that basis, let's take a look at the technical picture for Life360 (360), Aristocrat Leisure (ALL), Altium (ALU), Asx (ASX), Aventus Group (AVN), Breville Group (BRG), Csl (CSL), Enero Group (EGG), Galaxy Resources (GXY), Lynas Corporation (LYC), and Wesfarmers (WES).
Life360 (360)
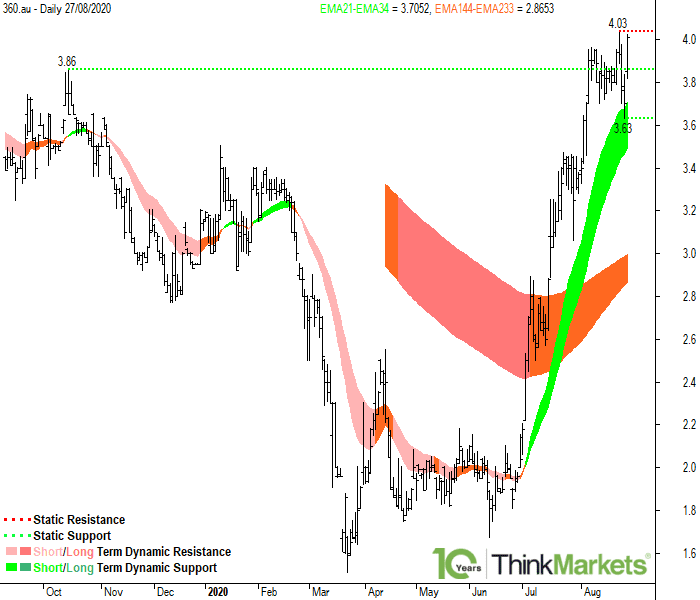
Life360 is in a well-defined short term uptrend, as evidenced by the 21 EMA located above the 34 EMA and with each EMA rising. The long term trend is undefined, as evidenced the 144 EMA located below the 233 EMA but with each EMA rising. It is likely that these EMAs cross in the near future, therefore initiating a new long term uptrend.
Static resistance will be encountered at the 24 Aug 2020 high of 4.030.
Static support will be encountered at the 26 Aug 2020 low of 3.630.
Note that static support at 3.630 coincides with dynamic short term support expected to be encountered in the zone defined by the 21-34 EMAs, projected between 3.500 and 3.700. Whenever multiple support factors coincide, the market response at the zone defined by these factors tends to be stronger.
Beyond 4.030, 360 has little in the way of key price action-based static resistance points to impede upside progress. Note however, static resistance will likely be encountered at the 5.000 round number.
Traders may wish to buy at the static and dynamic support zones with stops set below these levels. If this cannot be achieved, then traders may have to consider buying on a breach of today's high of 4.030.
Aristocrat Leisure (ALL)
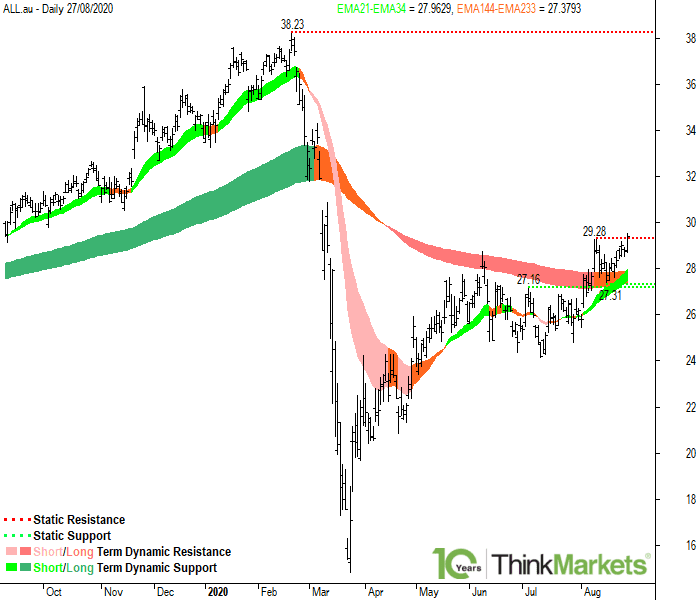
Aristocrat Leisure is in a well-defined short term uptrend, as evidenced by the 21 EMA located above the 34 EMA and with each EMA rising. The long term trend is undefined, as evidenced the 144 EMA located below the 233 EMA but with each EMA rising. It is likely that these EMAs cross in the near future, therefore initiating a new long term uptrend.
Static resistance will be encountered at the 11 Aug 2020 high of 29.28, and then at the 20 Feb 2020 high of 38.23.
Static support will be encountered at the 17 Aug 2020 low of 27.31, which coincides with the 03 Jul 2020 high of 27.16.
The dynamic short term support zone is defined by the 21-34 EMAs, projected between 27.40 and 28.00. The price has been consistently rebounding higher out of the short term dynamic support zone since the short term uptrend began in July. This highlights the importance of this zone as a future area of potential dynamic short term support going forwards.
The dynamic long term resistance zone is defined by the 21-34 EMAs, projected between 27.40 and 27.80. The price has been consistently rebounding lower out of the long term dynamic resistance zone since the long term downtrend began in April. The key issue now, is that the price is currently trading above this zone. If this situation continues, the zone may well switch from offering dynamic long term resistance to offering dynamic long term support.
Targets are to the 20 Feb 2020 high of 38.23. Beyond 38.23, ALL is at all-time highs, and therefore targets are open ended. Note however, static resistance will likely be ecountered at the 40.00 round number.
Traders may wish to buy at the static and dynamic support zones with stops set below these levels. If this cannot be achieved, then traders may have to consider buying on a breach of today's high of today's current high of 29.47.
Altium (ALU)
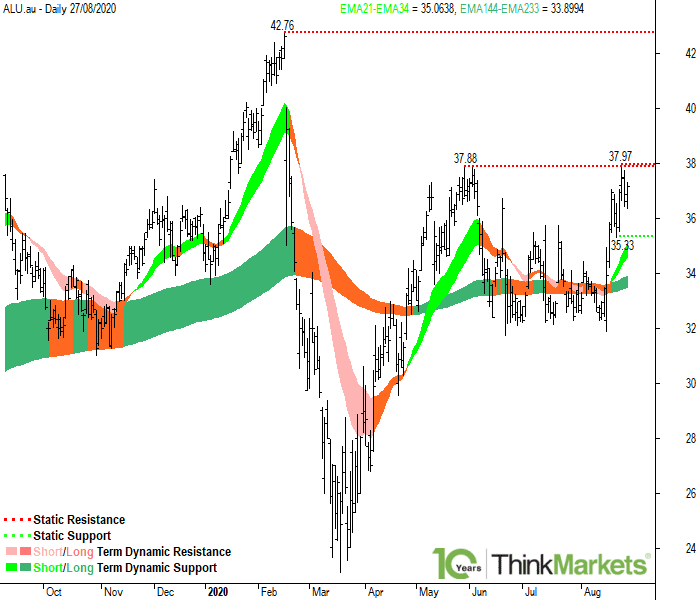
Altium is in a well-defined short term uptrend, as evidenced by the 21 EMA located above the 34 EMA and with each EMA rising. The long term uptrend is also well-defined, as evidenced by the 144 EMA located above the 233 EMA and with each EMA rising.
Static resistance will be encountered at the 28 May 2020 high of 37.88, which coincides with the 25 Aug 2020 high of 37.97, and then at the 17 Feb 2020 high of 42.76.
Static support will be encountered at the 21 Aug 2020 low of 35.33.
Note that static support at 35.33 coincides with dynamic short term support expected to be encountered in the zone defined by the 21-34 EMAs, projected between 34.80 and 35.35. Whenever multiple support factors coincide, the market response at the zone defined by these factors tends to be stronger.
Targets are to the 17 Feb 2020 high of 42.76. Beyond 42.76, ALU is at all-time highs, and therefore targets are open ended. Note however, static resistance will likely be ecountered at the 50.00 round number.
Traders may wish to buy at the static and dynamic support zones with stops set below these levels. If this cannot be achieved, then traders may have to consider buying on a breach of today's high of 37.97.
ASX (ASX)
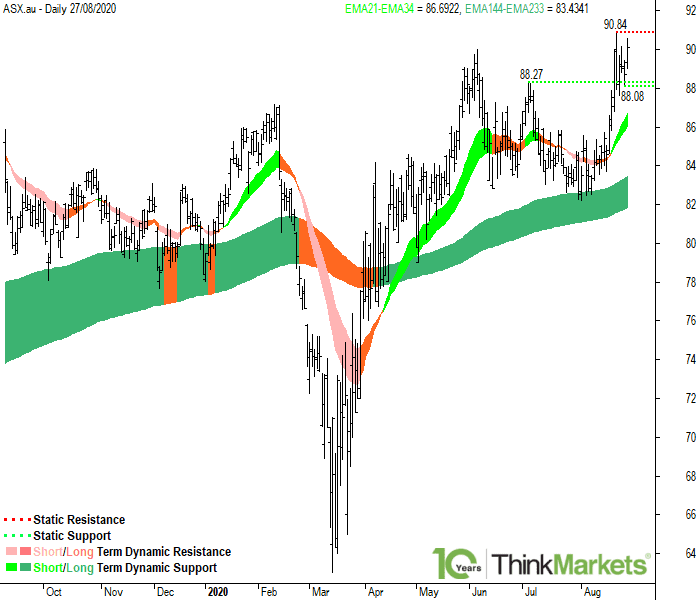
ASX is in a well-defined short term uptrend, as evidenced by the 21 EMA located above the 34 EMA and with each EMA rising. The long term uptrend is also well-defined, as evidenced by the 144 EMA located above the 233 EMA and with each EMA rising.
Static resistance will be encountered at the 21 Aug 2020 high of 90.84.
Static support will be encountered at the 26 Aug 2020 low of 88.08, which coincides with the 03 Jul 2020 high of 88.27.
The dynamic short term support zone is defined by the 21-34 EMAs, projected between 86.00 and 86.70.
Beyond 90.84, ASX is at all-time highs, and therefore targets are open ended. Note however, static resistance will likely be ecountered at the 100.00 round number.
Traders may wish to buy at the static and dynamic support zones with stops set below these levels. If this cannot be achieved, then traders may have to consider buying on a breach of today's high of 90.84.
Aventus Group (AVN)
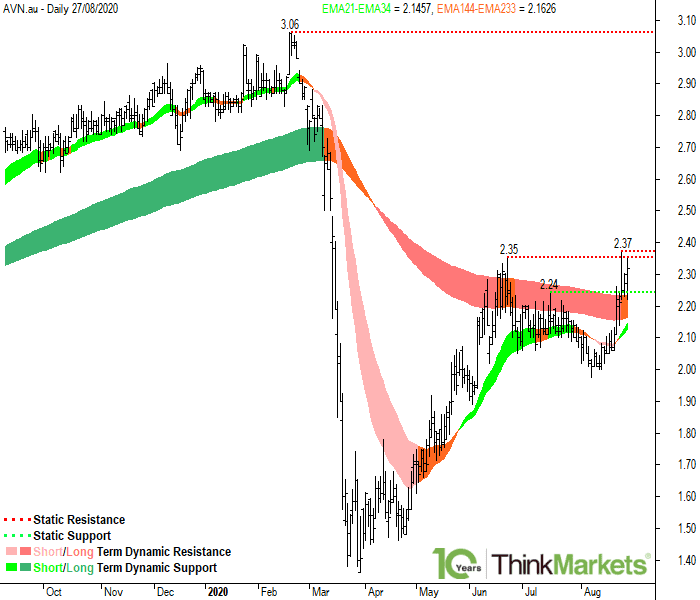
Aventus Group is in a well-defined short term uptrend, as evidenced by the 21 EMA located above the 34 EMA and with each EMA rising. The long term trend is undefined, as evidenced the 144 EMA located below the 233 EMA but with each EMA rising. It is likely that these EMAs cross in the near future, therefore initiating a new long term uptrend.
Static resistance will be encountered at the 23 Jun 2020 high of 2.35, which coincides with the 25 Aug 2020 high of 2.37, and then at the 20 Feb 2020 high of 3.06.
Static support will be encountered at the 16 Jul 2020 high of 2.24.
The dynamic short term support zone is defined by the 21-34 EMAs, projected between 2.12 and 2.15.
The dynamic long term resistance zone is defined by the 21-34 EMAs, projected between 2.17 and 2.25. The price has been consistently rebounding lower out of the long term dynamic resistance zone since the long term downtrend began in April. The key issue now, is that the price is currently trading above this zone. If this situation continues, the zone may well switch from offering dynamic long term resistance to offering dynamic long term support.
Targets are to the 20 Feb 2020 high of 3.06. Beyond 3.06, AVN is at all-time highs, and therefore targets are open ended. Note however, static resistance will likely be ecountered at the 4.00 round number.
Traders may wish to buy at the static and dynamic support zones with stops set below these levels. If this cannot be achieved, then traders may have to consider buying on a breach of today's high of 2.37.
Breville Group (BRG)
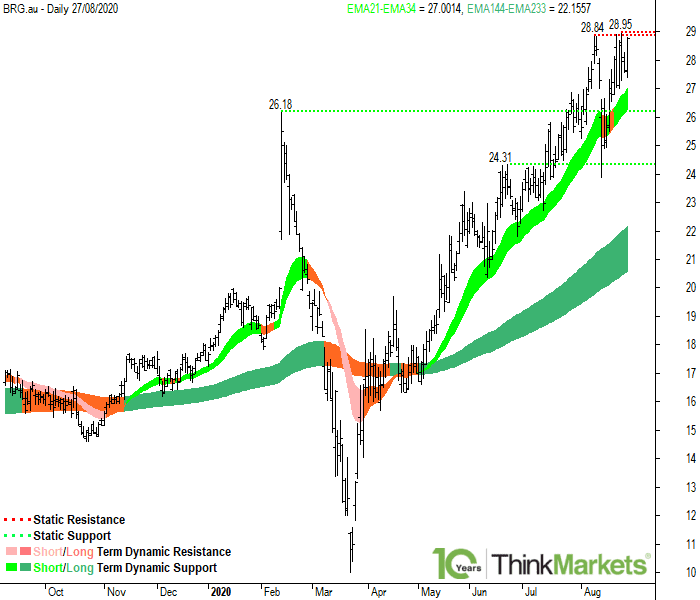
Breville Group is in a well-defined short term uptrend, as evidenced by the 21 EMA located above the 34 EMA and with each EMA rising. The long term uptrend is also well-defined, as evidenced by the 144 EMA located above the 233 EMA and with each EMA rising.
Static resistance will be encountered at the 25 Aug 2020 high of 28.95, which coincides with the 20.00 round number.
Static support will be encountered at the 13/ high of 26.18.
The dynamic short term support zone is defined by the 21-34 EMAs, projected between 26.30 and 27.10. The price has been consistently rebounding higher out of the short term dynamic support zone since the short term uptrend began in April. This highlights the importance of this zone as a future area of potential dynamic short term support going forwards.
Beyond 29.95, BRG is at all-time highs, and therefore targets are open ended. Note however, static resistance will likely be ecountered at the 35.00 round number.
Traders may wish to buy at the static and dynamic support zones with stops set below these levels. If this cannot be achieved, then traders may have to consider buying on a breach of today's high of 28.95.
CSL (CSL)
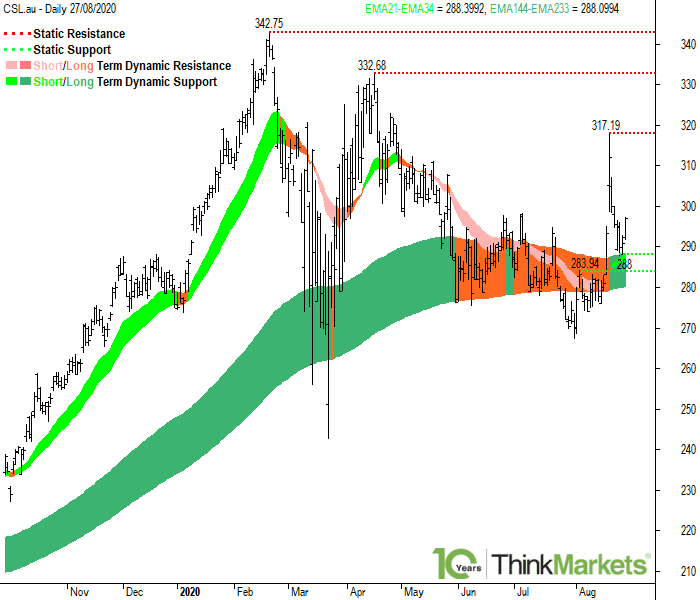
CSL is in a well-defined short term uptrend, as evidenced by the 21 EMA located above the 34 EMA and with each EMA rising. The long term uptrend is also well-defined, as evidenced by the 144 EMA located above the 233 EMA and with each EMA rising.
Static resistance will be encountered at the 19 Aug 2020 high of 317.19, the 17 Apr 2020 high of 332.68, and then at the 20 Feb 2020 high of 342.75.
Static support will be encountered at the 25 Aug 2020 low of 288.00, and then at the 04 Aug 2020 high of 283.94.
Note that static support at 288.00 coincides with dynamic short term support expected to be encountered in the zone defined by the 21-34 EMAs, projected between 287.00 and 290.00. Whenever multiple support factors coincide, the market response at the zone defined by these factors tends to be stronger.
The dynamic long term support zone is defined by the 21-34 EMAs, projected between 280.00 and 288.50. The price has been consistently rebounding higher out of the long term dynamic support zone since the long term uptrend began in Jan 2017.
Targets are to the 20 Feb 2020 high of 342.75. Beyond 342.75, CSL is at all-time highs, and therefore targets are open ended. Note however, static resistance will likely be ecountered at the 350.00 round number.
Traders may wish to buy at the static and dynamic support zones with stops set below these levels. If this cannot be achieved, then traders may have to consider buying on a breach of today's high of today's current high of 297.16.
Enero Group (EGG)
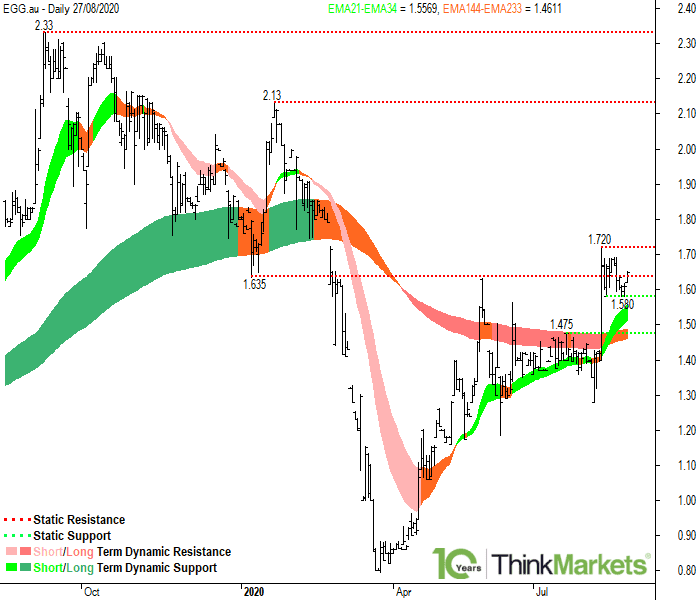
Enero Group is in a well-defined short term uptrend, as evidenced by the 21 EMA located above the 34 EMA and with each EMA rising. The long term trend is undefined, as evidenced the 144 EMA located below the 233 EMA but with each EMA rising. It is likely that these EMAs cross in the near future, therefore initiating a new long term uptrend.
Static resistance will be encountered at the 13 Aug 2020 high of 1.72, the 21 Jan 2020 high of 2.13, and then at the 10 Sep 2020 high of 2.33.
Static support will be encountered at the 25 Aug 2020 low of 1.58, and then at the 21 Jul 2020 high of 1.48.
Note that static support at 1.58 coincides with dynamic short term support expected to be encountered in the zone defined by the 21-34 EMAs, projected between 1.53 and 1.58. Whenever multiple support factors coincide, the market response at the zone defined by these factors tends to be stronger. The price has been consistently rebounding higher out of the short term dynamic support zone since the short term uptrend began in May. This highlights the importance of this zone as a future area of potential dynamic short term support going forwards.
The dynamic long term resistance zone is defined by the 21-34 EMAs, projected between 1.46 and 1.50. The price has been consistently rebounding lower out of the long term dynamic resistance zone since the long term downtrend began in April. The key issue now, is that the price is currently trading above this zone. If this situation continues, the zone may well switch from offering dynamic long term resistance to offering dynamic long term support.
Targets are to the 10 Sep 2020 high of 2.33. Beyond 2.33, EGG has little in the way of key price action-based static resistance points to impede upside progress. Note however, static resistance will likely be ecountered at the 3.00 round number.
Traders may wish to buy at the static and dynamic support zones with stops set below these levels. If this cannot be achieved, then traders may have to consider buying on a breach of today's high of today's current high of 1.65.
Galaxy Resources (GXY)
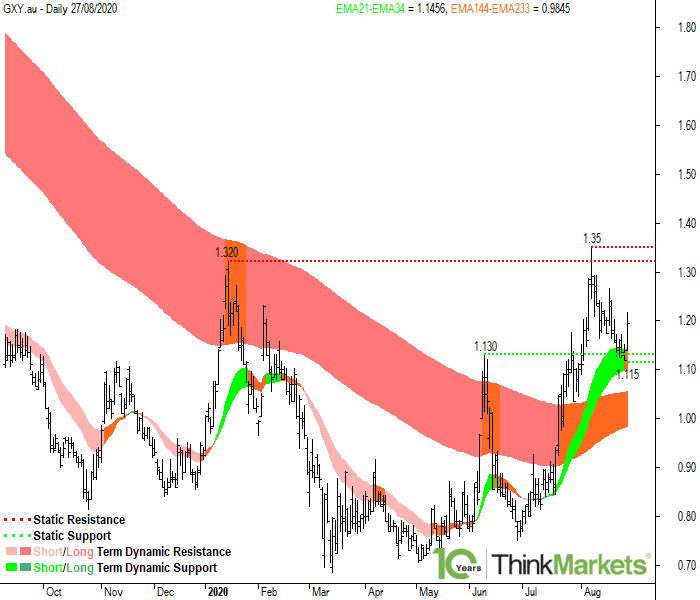
Galaxy Resources is in a well-defined short term uptrend, as evidenced by the 21 EMA located above the 34 EMA and with each EMA rising. The long term trend is undefined, as evidenced the 144 EMA located below the 233 EMA but with each EMA rising. It is likely that these EMAs cross in the near future, therefore initiating a new long term uptrend.
Static resistance will be encountered at the 15 Jan 2020 high of 1.32, which coincides with the 07 Aug 2020 high of 1.35.
Static support will be encountered at the 26 Aug 2020 low of 1.12, which coincides with the 10 Jun 2020 high of 1.13.
Note that static support at 1.12 coincides with dynamic short term support expected to be encountered in the zone defined by the 21-34 EMAs, projected between 1.11 and 1.16. Whenever multiple support factors coincide, the market response at the zone defined by these factors tends to be stronger.
The dynamic long term resistance zone is defined by the 21-34 EMAs, projected between 1.00 and 1.05. The price has been consistently rebounding lower out of the long term dynamic resistance zone since the long term downtrend began in Sep 2018. The key issue now, is that the price is currently trading above this zone. If this situation continues, the zone may well switch from offering dynamic long term resistance to offering dynamic long term support.
Targets are to the 07 Aug 2020 high of 1.35. Beyond 1.35, GXY has little in the way of key price action-based static resistance points to impede upside progress. Note however, static resistance will likely be ecountered at the 1.50 round number.
Traders may wish to buy at the static and dynamic support zones with stops set below these levels. If this cannot be achieved, then traders may have to consider buying on a breach of today's high of today's current high of 1.215.
Lynas Corporation (LYC)
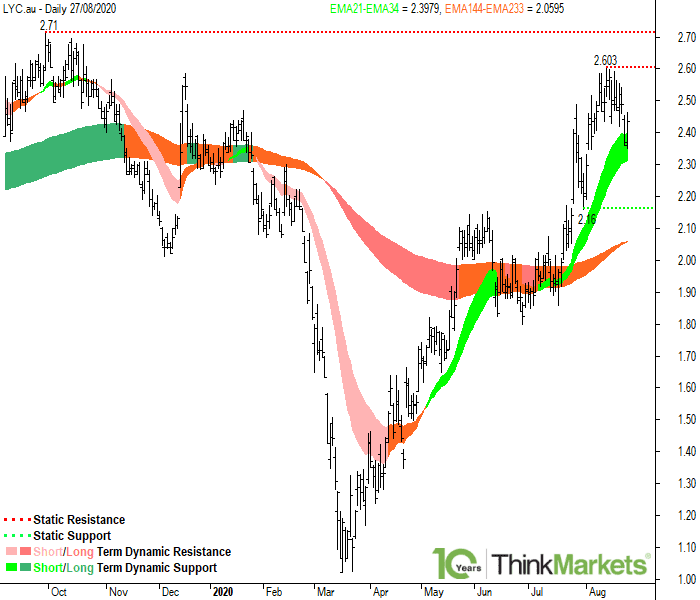
Lynas Corporation is in a well-defined short term uptrend, as evidenced by the 21 EMA located above the 34 EMA and with each EMA rising. The long term trend is undefined, as evidenced the 144 EMA located below the 233 EMA but with each EMA rising. It is likely that these EMAs cross in the near future, therefore initiating a new long term uptrend.
Static resistance will be encountered at the 13 Aug 2020 high of 2.60, and then at the 30 Sep 2020 high of 2.71.
Static support will be encountered at the 31 Jul 2020 low of 2.16.
Today's low 2.35 coincides with dynamic short term support expected to be encountered in the zone defined by the 21-34 EMAs, projected between 2.32 and 2.41. The price has been consistently rebounding higher out of the short term dynamic support zone since the short term uptrend began in May. This highlights the importance of this zone as a future area of potential dynamic short term support going forwards.
The dynamic long term resistance zone is defined by the 21-34 EMAs, projected between 2.05 and 2.07. Interestingly, the price has been consistently rebounding higher out of this zone since the long term downtrend began in March. It is likely it will continue to provide dynamic long term support until the long term EMAs cross over to officially initiate a new long term uptrend.
Targets are to the 30 Sep 2020 high of 2.71. Beyond 2.71, LYC has little in the way of key price action-based static resistance points to impede upside progress. Note however, static resistance will likely be ecountered at the 3.00 round number.
Traders may wish to buy at the static and dynamic support zones with stops set below these levels. If this cannot be achieved, then traders may have to consider buying on a breach of today's high of today's current high of 2.46.
Wesfarmers (WES)
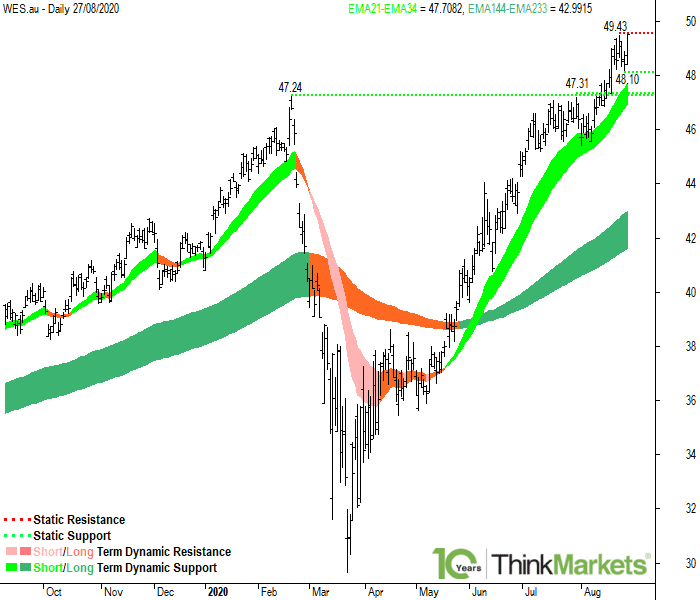
Wesfarmers is in a well-defined short term uptrend, as evidenced by the 21 EMA located above the 34 EMA and with each EMA rising. The long term uptrend is also well-defined, as evidenced by the 144 EMA located above the 233 EMA and with each EMA rising.
Static resistance will be encountered at the 24 Aug 2020 high of 49.43.
Static support will be encountered at the 26 Aug 2020 low of 48.85, and then at the 30 Jul 2020 high of 47.31, which coincides with the 20 Feb 2020 high of 47.24.
The dynamic short term support zone is defined by the 21-34 EMAs, projected between 47.00 and 47.80. The price has been consistently rebounding higher out of the short term dynamic support zone since the short term uptrend began in May. This highlights the importance of this zone as a future area of potential dynamic short term support going forwards.
Beyond 49.43, WES is at all-time highs, and therefore targets are open ended. Note however, static resistance will likely be ecountered at the 60.00 round number.
Traders may wish to buy at the static and dynamic support zones with stops set below these levels. If this cannot be achieved, then traders may have to consider buying on a breach of 49.43.