A topical look at technical analysis factors for a number of key markets, and ASX stocks of interest for 31 August.
In today's ThinkTechnical we'll take a look at the technical picture for an interesting mix of stocks from a wide range of sectors.
We have:
Small cap mineral explorers Antipa Minerals (AZY) (gold and copper), Legend Mining (LEG) (nickel and copper);
Gold mining major Kirkland Lake Gold (KLA);
Online gaming operator Jumbo Interactive (JIN);
Packaging manufacturer and supplier Pact Group (PGH);
Small cap biotech Prescient Therapeutics (PTX);
And finally, communications, computing and electronics provider Vita Group (VTG).
Antipa Minerals (AZY)
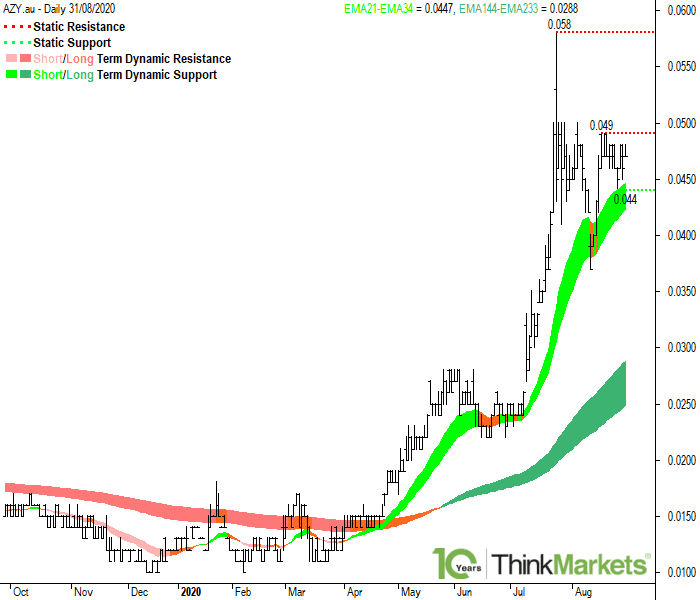
Antipa Minerals is in a well-defined short term uptrend, as evidenced by the 21 EMA located above the 34 EMA and with each EMA rising. The long term uptrend is also well-defined, as evidenced by the 144 EMA located above the 233 EMA and with each EMA rising.
Static resistance will be encountered at the 17 Aug 2020 high of 0.049, and then at the 24 Jul 2020 high of 0.058.
Static support will be encountered at the 26 Aug 2020 low of 0.044.
Note that static support at 0.044 coincides with dynamic short term support expected to be encountered in the zone defined by the 21-34 EMAs, projected between 0.042 and 0.045. Whenever multiple support factors coincide, the market response at the zone defined by these factors tends to be stronger. The price has been consistently rebounding higher out of the short term dynamic support zone since the short term uptrend began in March. This highlights the importance of this zone as a future area of potential dynamic short term support going forwards.
Targets are to the 24 Jul 2020 high of 0.058. Beyond 0.058, AZY has little in the way of key price action-based static resistance points to impede upside progress. Note however, static resistance will likely be encountered at the 0.100 round number.
Traders may wish to buy at the static and dynamic support zones with stops set below these levels. If this cannot be achieved, then traders may have to consider buying on a breach of 0.049.
Jumbo Interactive (JIN)
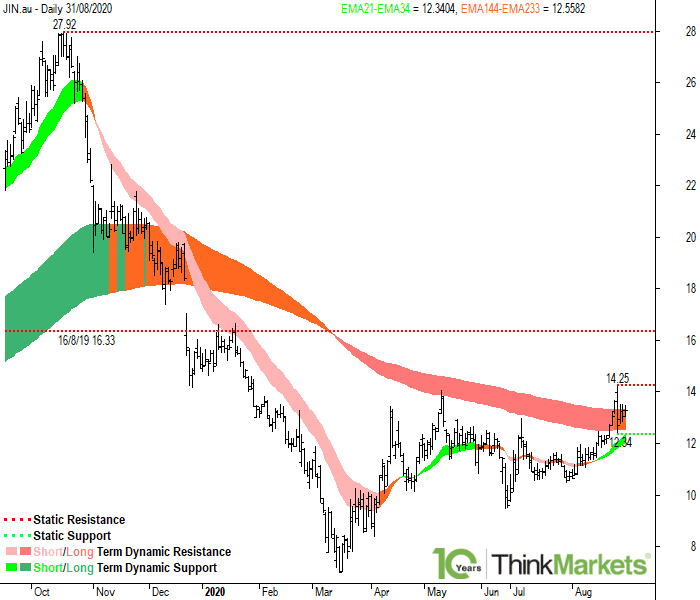
Jumbo Interactive is in a well-defined short term uptrend, as evidenced by the 21 EMA located above the 34 EMA and with each EMA rising. The long term trend is undefined, as evidenced the 144 EMA located below the 233 EMA but with each EMA rising. It is likely that these EMAs cross in the near future, therefore initiating a new long term uptrend.
Static resistance will be encountered at the 26 Aug 2020 high of 14.25, the 16 Aug 2019 low of 16.33, and then at the 17 Oct 2019 high of 27.92.
Static support will be encountered at the 26 Aug 2020 low of 12.34.
The dynamic short term support zone is defined by the 21-34 EMAs, projected between 12.05 and 12.40.
The dynamic long term support zone is defined by the 21-34 EMAs, projected between 12.60 and 13.40. The price has been consistently rebounding lower out of the long term dynamic resistance zone since the long term downtrend began in March. The key issue now, is that the price is currently trading above this zone. If this situation continues, the zone may well switch from offering dynamic long term resistance to offering dynamic long term support.
Targets are to the 16 Aug 2019 high of 16.33. The next key target is 27.92. Note however, static resistance will likely be ecountered at the 15.00 round number.
Traders may wish to buy at the static and dynamic support zones with stops set below these levels. If this cannot be achieved, then traders may have to consider buying on a breach of 14.25.
Kirkland Lake Gold (KLA)
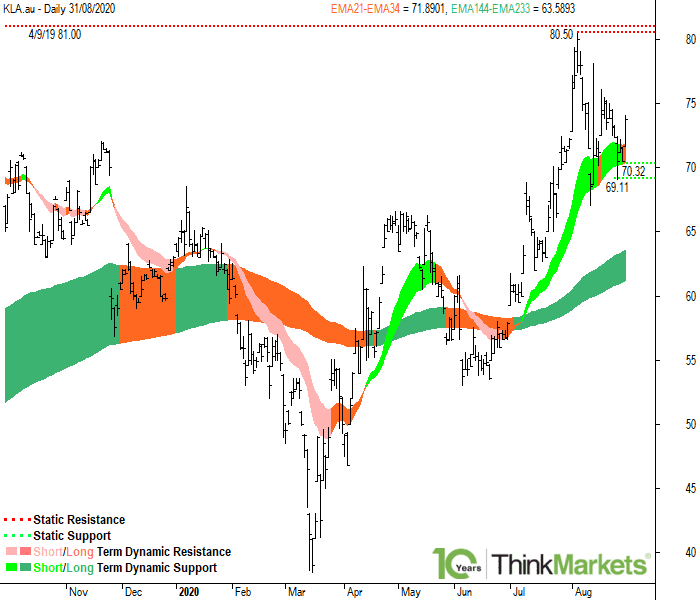
Kirkland Lake Gold is in a short term uptrend, as evidenced by the 21 EMA located above the 34 EMA. The long term uptrend is well-defined, as evidenced by the 144 EMA located above the 233 EMA and with each EMA rising.
Static resistance will be encountered at the 05 Aug 2020 high of 80.50, and then at the 04 Sep 2019 high of 81.00.
Static support will be encountered at the 28 Aug 2020 low of 70.32, and then at the 26 Aug 2020 low of 69.11, which coincides with the 70.00 round number.
Note that static support at 70.32 coincides with dynamic short term support expected to be encountered in the zone defined by the 21-34 EMAs, projected between 70.30 and 72.00. Whenever multiple support factors coincide, the market response at the zone defined by these factors tends to be stronger. The price has been consistently rebounding higher out of the short term dynamic support zone since the short term uptrend began in July. This highlights the importance of this zone as a future area of potential dynamic short term support going forwards.
Targets are to the 04 Sep 2019 high of 81.00. Beyond 81.00, KLA is at all-time highs, and therefore targets are open ended.
Traders may wish to buy at the static and dynamic support zones with stops set below these levels. If this cannot be achieved, then traders may have to consider buying on a breach of today's current high of 74.00.
Legend Mining (LEG)
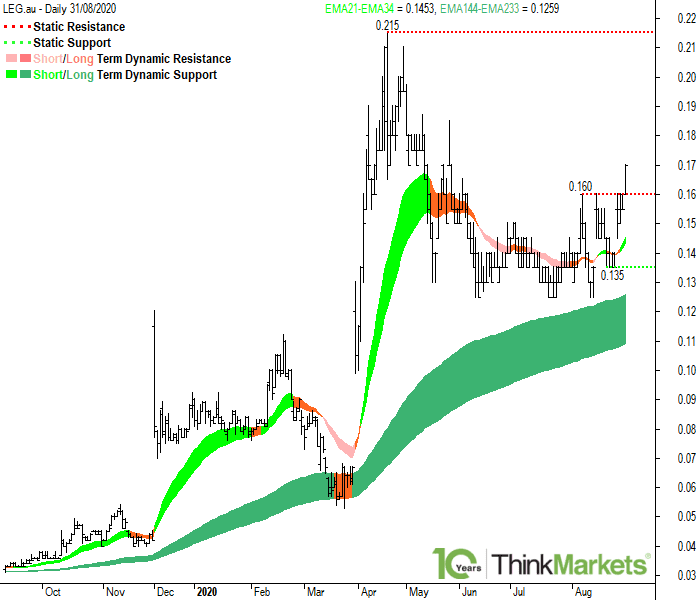
Legend Mining is in a newly defined short term uptrend, as evidenced by the recent cross over of the 21-34 EMAs and with each EMA rising. The long term uptrend is well-defined, as evidenced by the 144 EMA located above the 233 EMA and with each EMA rising.
Static resistance will be encountered at the 07 Aug 2020 high of 0.160, and then at the 22 Apr 2020 high of 0.215.
Static support will be encountered at the 21 Aug 2020 low of 0.135.
The dynamic short term support zone is defined by the 21-34 EMAs, projected between 0.145 and 0.150. The price has been consistently rebounding higher out of the short term dynamic support zone since the short term uptrend began in early August. This highlights the importance of this zone as a future area of potential dynamic short term support going forwards.
Targets are to the 22 Apr 2020 high of 0.215. Beyond 0.215, LEG is at all-time highs, and therefore targets are open ended.
Traders may wish to buy at the static and dynamic support zones with stops set below these levels. If this cannot be achieved, then traders may have to consider buying on a breach of 0.165.
Pact Group (PGH)
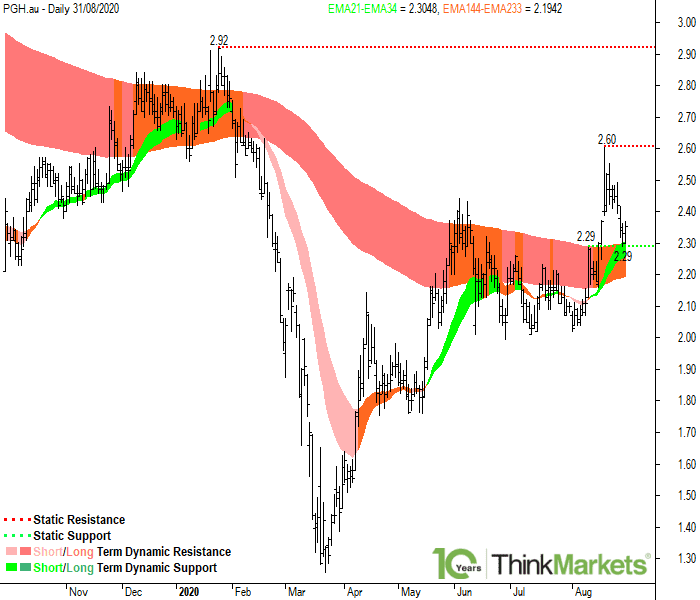
Pact Group is in a well-defined short term uptrend, as evidenced by the 21 EMA located above the 34 EMA and with each EMA rising. The long term trend is undefined, as evidenced the 144 EMA located below the 233 EMA but with each EMA rising. It is likely that these EMAs cross in the near future, therefore initiating a new long term uptrend.
Static resistance will be encountered at the 19 Aug 2020 high of 2.60, and then at the 24 Jan 2020 high of 2.92.
Static support will be encountered at the 28 Aug 2020 low of 2.29, which coincides with the 11 Aug 2020 high of 2.29. Whenever multiple support factors coincide, the market response at the zone defined by these factors tends to be stronger.
Note that static support at 2.29 coincides with dynamic short term support expected to be encountered in the zone defined by the 21-34 EMAs, projected between 2.25 and 2.30. Whenever multiple support factors coincide, the market response at the zone defined by these factors tends to be stronger.
The dynamic long term support zone is defined by the 21-34 EMAs, projected between 2.20 and 2.30. The price has been consistently rebounding lower out of the long term dynamic resistance zone since the long term downtrend began in August 2017. The key issue now, is that the price is currently trading above this zone. If this situation continues, the zone may well switch from offering dynamic long term resistance to offering dynamic long term support.
Targets are to the 19 Aug 2020 high of 2.60. The next key target is 2.92.
Traders may wish to buy at the static and dynamic support zones with stops set below these levels. If this cannot be achieved, then traders may have to consider buying on a breach of today's current high of 2.37.
Prescient Therapeutics (PTX)
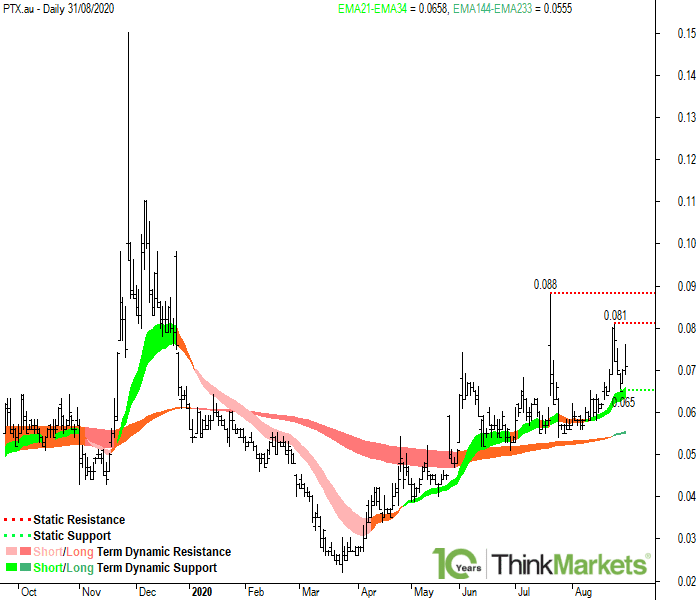
Prescient Therapeutics is in a well-defined short term uptrend, as evidenced by the 21 EMA located above the 34 EMA and with each EMA rising. The long term uptrend is newly defined, as evidenced by the recent cross over of the 144-233 EMAs and with each EMA rising.
Static resistance will be encountered at the 25 Aug 2020 high of 0.081, and then at the 21 Jul 2020 high of 0.088.
Static support will be encountered at the 27 Aug 2020 low of 0.065.
Note that static support at 0.065 coincides with dynamic short term support expected to be encountered in the zone defined by the 21-34 EMAs, projected between 0.063 and 0.067. Whenever multiple support factors coincide, the market response at the zone defined by these factors tends to be stronger. The price has been consistently rebounding higher out of the short term dynamic support zone since the short term uptrend began in April. This highlights the importance of this zone as a future area of potential dynamic short term support going forwards.
Targets are to the 21 Jul 2020 high of 0.088. Beyond 0.088, PTX has little in the way of key price action-based static resistance points to impede upside progress. Note however, static resistance will likely be encountered at the 0.100 round number.
Traders may wish to buy at the static and dynamic support zones with stops set below these levels. If this cannot be achieved, then traders may have to consider buying on a breach of today's current high of 0.076.
Vita Group (VTG)
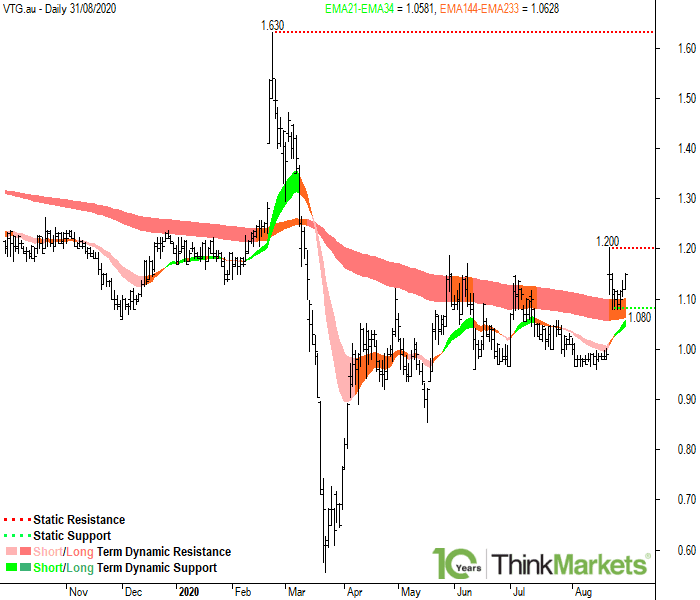
Vita Group is in a newly defined short term uptrend, as evidenced by the recent cross over of the 21-34 EMAs and with each EMA rising. The long term trend is undefined, as evidenced the 144 EMA located below the 233 EMA but with each EMA rising. It is likely that these EMAs cross in the near future, therefore initiating a new long term uptrend.
Static resistance will be encountered at the 21 Aug 2020 high of 1.200, and then at the 24 Feb 2020 high of 1.630.
Static support will be encountered at the 25 Aug 2020 low of 1.080.
The dynamic short term support zone is defined by the 21-34 EMAs, projected between 1.050 and 1.060.
The dynamic long term support zone is defined by the 21-34 EMAs, projected between 1.070 and 1.110. The price has been consistently rebounding lower out of the long term dynamic resistance zone since the long term downtrend began in September 2019. The key issue now, is that the price is currently trading above this zone. If this situation continues, the zone may well switch from offering dynamic long term resistance to offering dynamic long term support.
Targets are to the 24 Feb 2020 high of 1.630.
Traders may wish to buy at the static and dynamic support zones with stops set below these levels. If this cannot be achieved, then traders may have to consider buying on a breach of today's current high of 1.150.