Investors and traders have been buzzing in the last few days as gold prices reached a new all-time high of $2149. The price of gold also temporarily left behind the 40-month-old price range that has kept prices at bay since August 2020. A critical technical development that, if sustained, could put investors in a gold fever.
Gold Rush: Reaching New Heights
Over the last 40 months, gold trading has been rather muted, and the never-ending rate hikes were close to breaking investors’ confidence. However, the fundamental backdrop has changed quickly in recent weeks, and central banks’ tough talk on higher rates for longer appears to be empty threats.
One key factor driving the recent gold rally is the significant drop in inflation rates on both sides of the Atlantic. For instance, the latest reading shows that Eurozone annual inflation has fallen from over 10% in mid-2022 to approximately 2.4%. The sharp drop in inflation has caused traders to pencil in the first ECB rate cut as early as April 2024, with possibly three additional rate cuts before 2024 is over.
US inflation has also been dropping in recent months, and last week, the US PCE annual inflation reading came in at 3%. While the US ISM Manufacturing reading was disappointing once again and remained at 46.7, in deep contraction mode. The combination of lower inflation and a slower economy is boosting demand for gold as predicted.
Geopolitical tensions flare up
Fighting between Israel-Hamas resumed, firmly squashing peace negotiations, and the Houthis, an Iran-backed rebel group, attacked the commercial vessels and the US warship Carney as they passed Africa’s horn, heading for the Suez Canal.
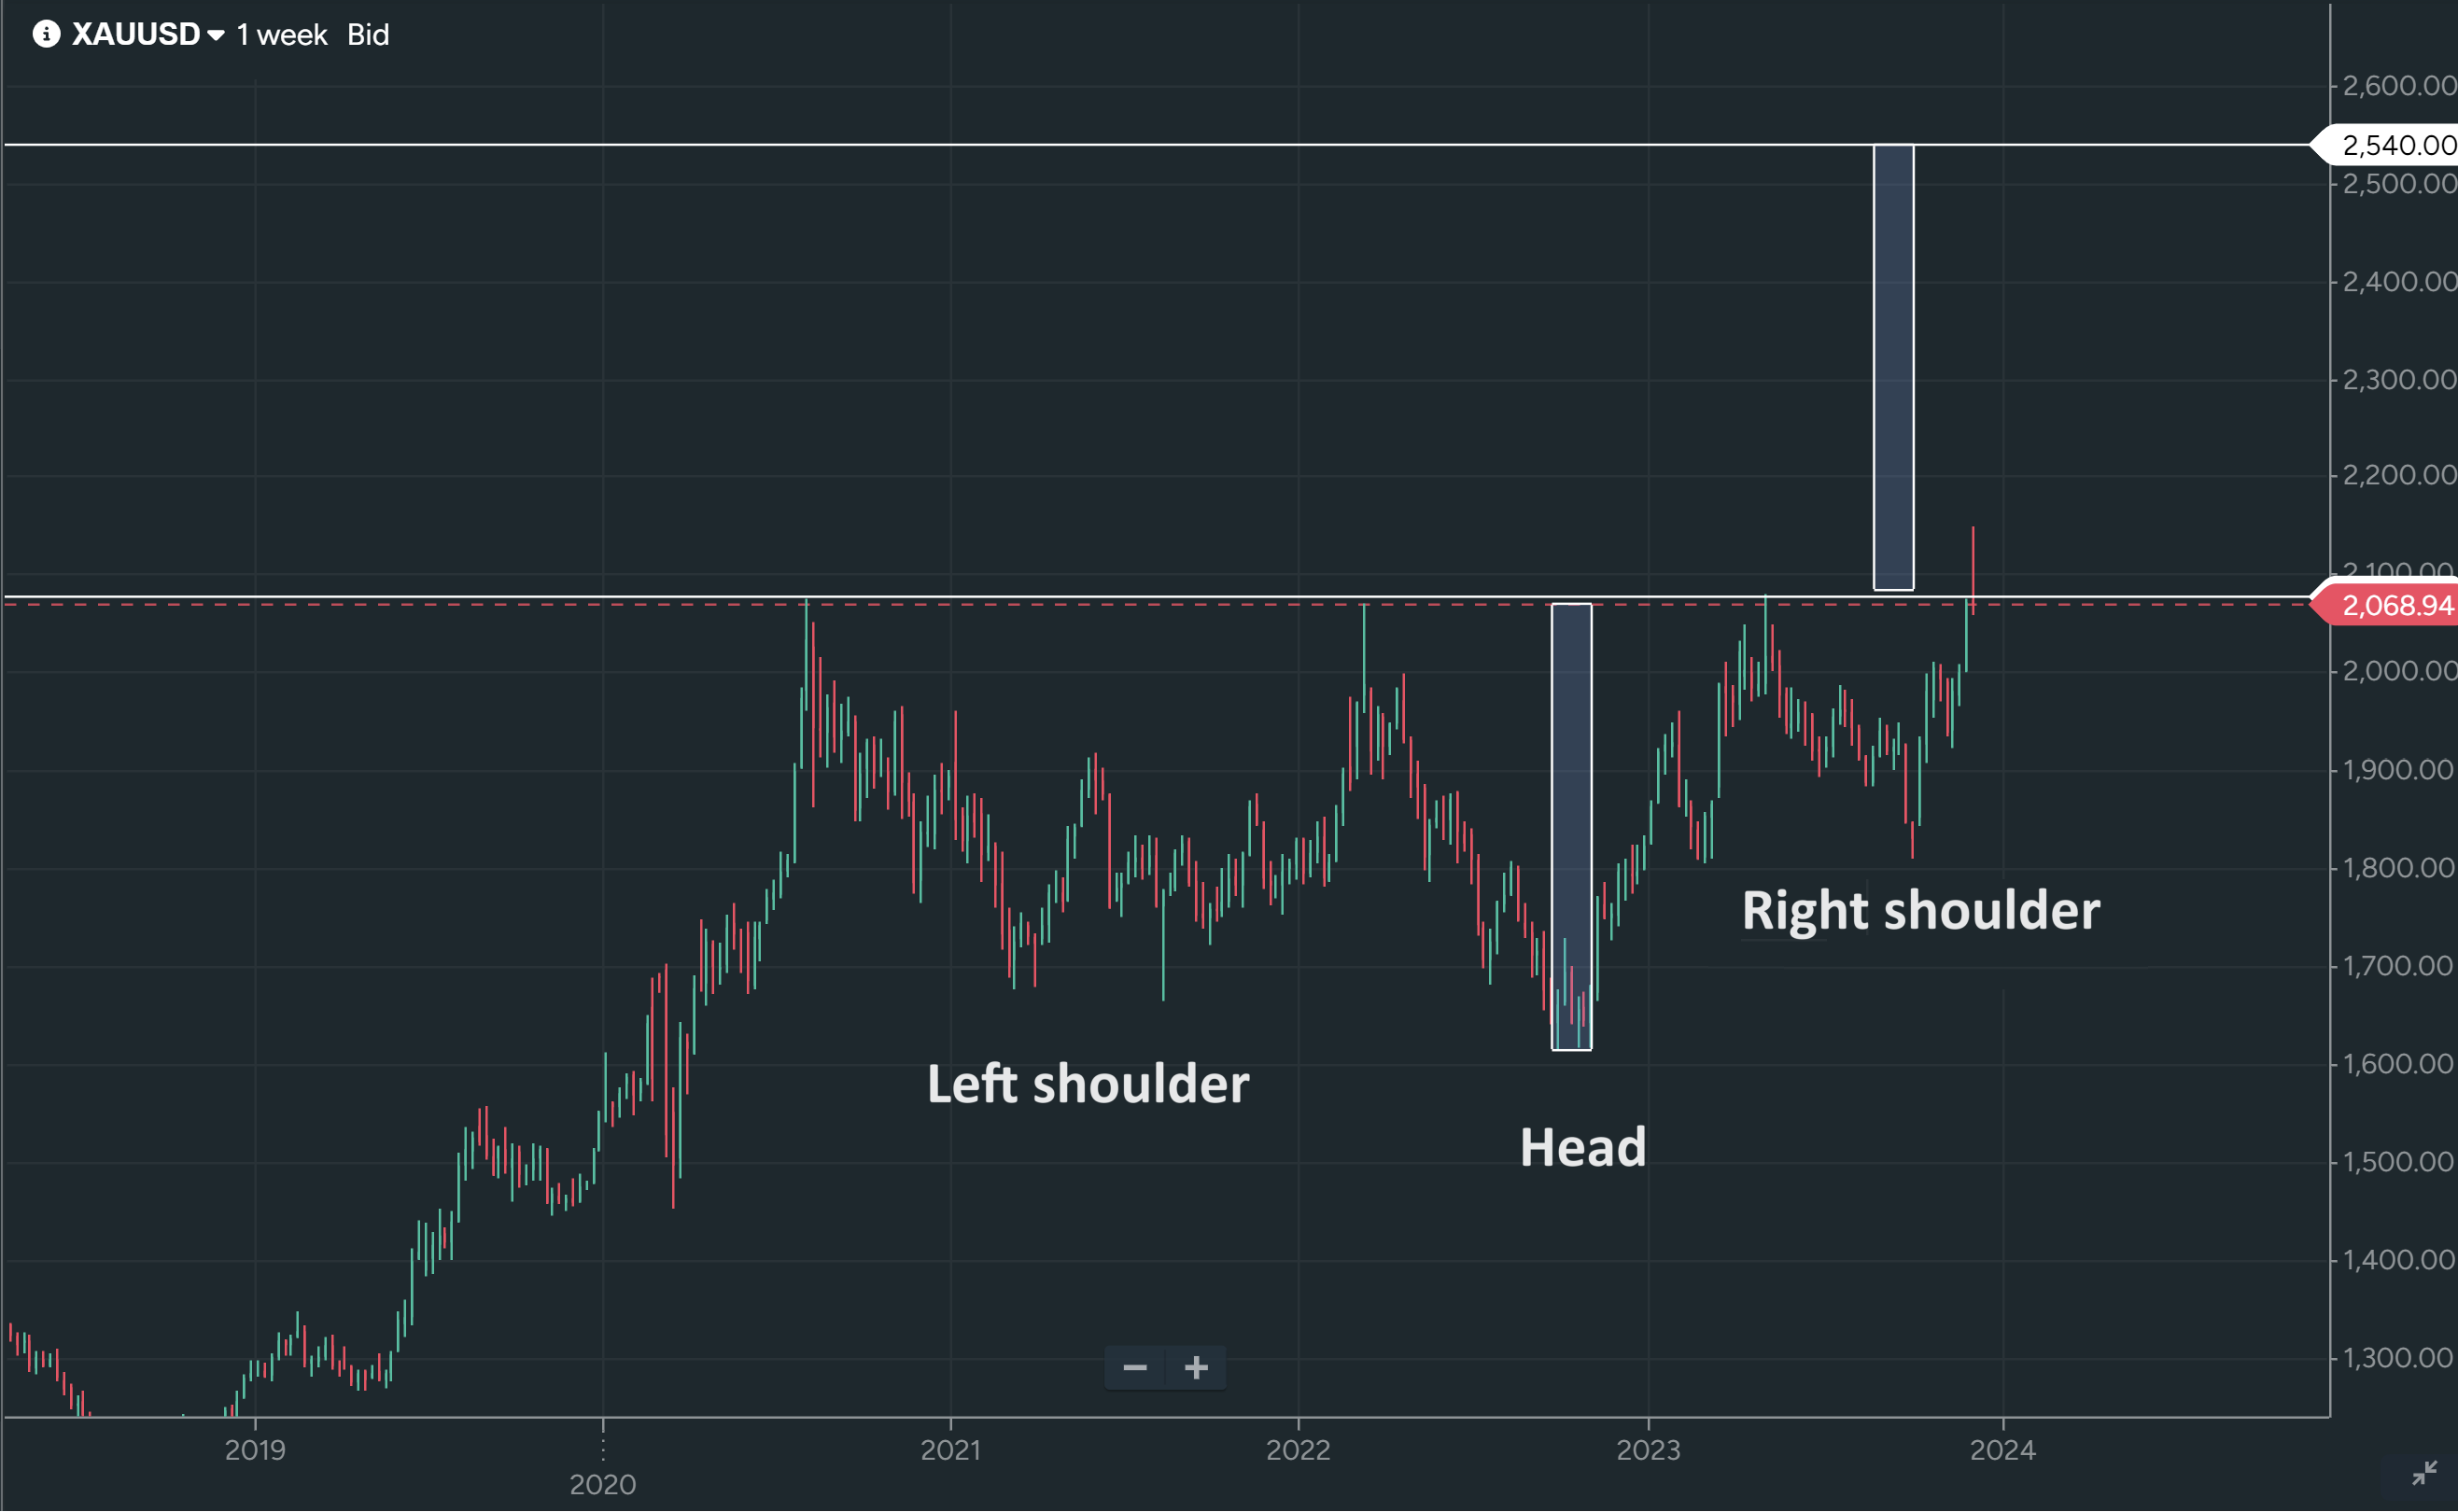
H&S patterns suggest a surge to $2540
An inverse head and shoulders pattern is typically observed when the market is bottoming out. However, over my 17 years of trading experience, I have also applied this pattern to situations where the market is trading sideways, as we've seen in recent months. This pattern was triggered today when the price surpassed the $2077 level. However, it's important to note that the bulls faced rejection despite this trigger, and the price is currently well below that level.
Nevertheless, today's decline in price wasn't significant enough to signal the end of the short-term trend. As long as the price remains above the $2030 mark, there is still a possibility that it might attempt to push above $2077 once more. If it does, the next potential target to watch for in the coming months could be $2540 as per the head and shoulders pattern.
Gold price, weekly chart
This material is comprised of personal opinions and ideas. The content should not be construed as containing any type of investment recommendation and/or a solicitation for any transactions. It does not imply an obligation to purchase investment services, nor does it guarantee or predict future performance. ThinkMarkets, its affiliates, agents, directors, officers or employees do not guarantee the accuracy, validity, timeliness or completeness of any information or data made available and assume no liability for any loss arising from any investment based on the same.
Any opinions, news, research, analyses, prices or other information contained on this website is provided as general market commentary and does not constitute investment advice. ThinkMarkets will not accept liability for any loss or damage including, without limitation, to any loss of profit which may arise directly or indirectly from use of or reliance on such information.

Learn and earn more today.
Visit our Education Centre