It's earnings season again! This one has dropped in the middle of what is proving to be a rather turbulent period for markets. There's lots going on, and high-PE-high-growth stocks appear to be bearing the brunt of investors' concerns. In this article, we review the earnings reports of three of our favourite ASX healthcare stocks. Buy, hold, or sell?
Highlights:
- CSL overview, interim results, broker consensus & financials, technical analysis, valuation & rating
- Pro Medicus overview, interim results, broker consensus & financials, technical analysis, valuation & rating
- EBOS Group overview, interim results, broker consensus & financials, technical analysis, valuation & rating
CSL
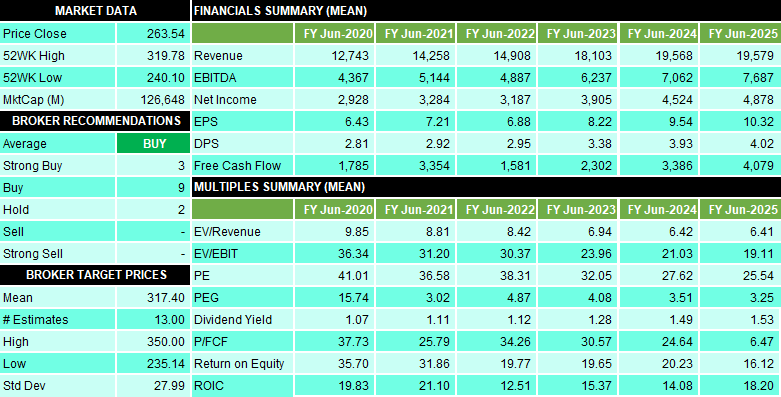
Rating: HOLD, MODERATE RISK Price Target: $294.50 (+11%)
Business Overview
CSL is one of Australia's oldest companies, founded in 1916 by the Australian Government originally to manufacture vaccines for the then-fledgling Commonwealth. Clearly it's come a long way since its Commonwealth Serum Laboratories days. Over the last three decades since listing on the ASX, it has evolved into a global biotechnology leader specialising in blood plasma products, vaccine production, and the treatment of immunodeficiencies and bleeding disorders among other things.
In December 2021, CSL announced its intent to purchase Swiss immunodeficiency pharmaceuticals company Vifor Pharma. According to CSL's CEO Paul Perreault, the Vifor Pharma deal was not done simply for the sake of making a deal and getting bigger! Rather, it was the culmination of years of careful due diligence, strategic consideration, and perhaps most importantly, of getting the timing right. It's probably worth giving CSL management the benefit of the doubt on Vifor. The company has a solid track record of adding significant shareholder value via large, strategic, and often company-changing acquisitions. Take for examples the purchase of ZLB in 2000, Aventis Behring in 2004, and of Seqirus in 2015.
Indeed, Vifor appears to fit CSL's existing business well. It develops and sells a number of treatments for iron deficiencies, hereditary bleeding disorders, and cardio-renal conditions. Exposure to these segments, particularly the treatment of kidney disorders, is generally lacking from CSL's current suite of blood plasma products. Vifor could make up approximately 16% of CSL's revenue once it is fully incorporated, and the deal is expected to unlock over $100 million of cost synergies in the short term. Management expects it will be both EPS and operational cashflow positive by FY23.
To pay for the acquisition, CSL undertook the biggest ever capital raising in ASX history outside of the Telstra IPOs back in the late 90's and early 2000's. $6.3 billion was raised from institutional investors via a placement at $273, and $750 million was raised from mum and dad shareholders via a share purchase plan at $253.57. It's typical for discounts to be dangled in front of investors to ensure timely capital raises, but this one was particularly juicy considering CSL shares closed at $297.27 the day before the takeover announcement.
The big question for investors is whether the discount required to get the Vifor deal over the line provides a rare opportunity for investors to purchase shares in a quality company like CSL while they're on sale.
Interim Results
CSL has had a tough time of it through 2020 and 2021 as the pandemic limited its ability to collect blood from customers, particularly in the US. Blood plasma is an important raw material for CSL which uses it to manufacture its range of immunoglobulin products. This is the main reason behind the slowdown in CSL's earnings growth over the period (earnings per share grew by 3% in FY20, and by 12% in FY21 compared to 42% growth in FY18 and 19% in FY19).
In the interim report released on 16 Feb for the half year to December 31, the company noted that plasma collections bounced back 18%. This impressive result was facilitated partly by better access to centres by donors as the impact of the pandemic eased in many US states, but also by opening 18 new collection centres during the period (note, CSL has opened 83 new collection centres since the start of the pandemic versus 230 existing centres pre-pandemic).
The fight to maintain collections, which are the lifeblood of the CSL business (yes, pun intended!), negatively impacted CSL's bottom line for the period however. Increased expenses relating to expanding, running, and marketing collection sites whittled 3% off net profit after tax (NPAT) for the half compared to the previous corresponding period (pcp).
Looking ahead, whilst management conceded the FY22 result is heavily skewed towards the first half, the outlook for the second half remained focussed on improving plasma collections which it expects to underpin stronger immunoglobulin and albumin sales. Management also reaffirmed NPAT guidance of $2.15 billion to $2.25 billion in constant currency terms. Looking forward, they noted CSL's improving medium term outlook as the impact of COVID on the broader business receded, and given that a cluster of R&D programs were nearing completion and looked "promising".
Broker Consensus & Financials
There are 14 brokers on record for CSL at the moment. 3 are at a "Strong Buy", 9 are at a "Buy", and 2 are at a "Hold". Interestingly, for a stock with this much coverage, it's encouraging to see that not a single broker rates the company as a "Sell" or "Strong Sell". The brokers' average price target is $317.40, the lowest price target is $235.14, and the highest price target is $350. The average price target is approximately 19% above the current share price.
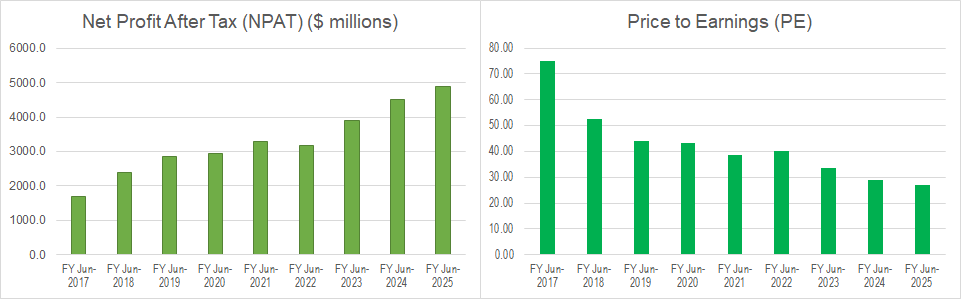
For many years, CSL has been priced as a "high-PE" stock due to its exceptional and reliable earnings growth. This means that investors have tended pay a higher PE for CSL due to their confidence in CSL's ability to grow its earnings quickly. The greater and more rapid a company's earnings growth, the greater and more rapid is the reduction in tis PE for a holder. For example, if you paid 40 times earnings for a stock that is expected to double its profit next year, it is akin to paying 20 times earnings for the same stock in a year's time — that is if you could buy it at the same price in a year's time!
Of course, the ability to pay the same price today for the stock in a year's time is just as uncertain as that stock doubling its earnings in a year. You have to be very confident the expected earnings growth will occur, because if it doesn’t, you'll be paying a higher PE than you bargained for. The risk inherent in such assumptions generally evolves from management's ability to execute their strategy and deliver earnings as expected. We call this risk "execution risk". We prefer to think of our valuations and ratings in terms of their execution risk (reward vs risk!).
With respect to CSL, we rate the execution risk associated with achieving our forecast earnings and growth forecasts as "MODERATE". We can't go "LOW" just yet due to the lingering effects of the pandemic, but we do feel CSL is definitely on the right side of it for now. But, anything can happen (Delta, Omicron…next?) so we'll continue to hedge our bets a little on CSL's risk rating.
The forecast earnings growth we refer to is an impressive 15% per annum average out to FY25. This should drive CSL's PE ratio down from the current 38 times FY22 earnings to a far more attractive 25.5 times FY25 earnings. The dividend yield is expected to average around 1.3% over this time, and it is unfranked.
Clearly, income investors should think seriously before allocating capital to CSL! But, you're not buying CSL for its yield, you're buying it for its strong management, near-bulletproof reliability, and its attractive growth. The other little quirk we like about CSL right now, is that whilst it has attractive defensive qualities as a healthcare company, it also has significant exposure to the reopening due to the improving outlook for plasma collections.
Technical Analysis
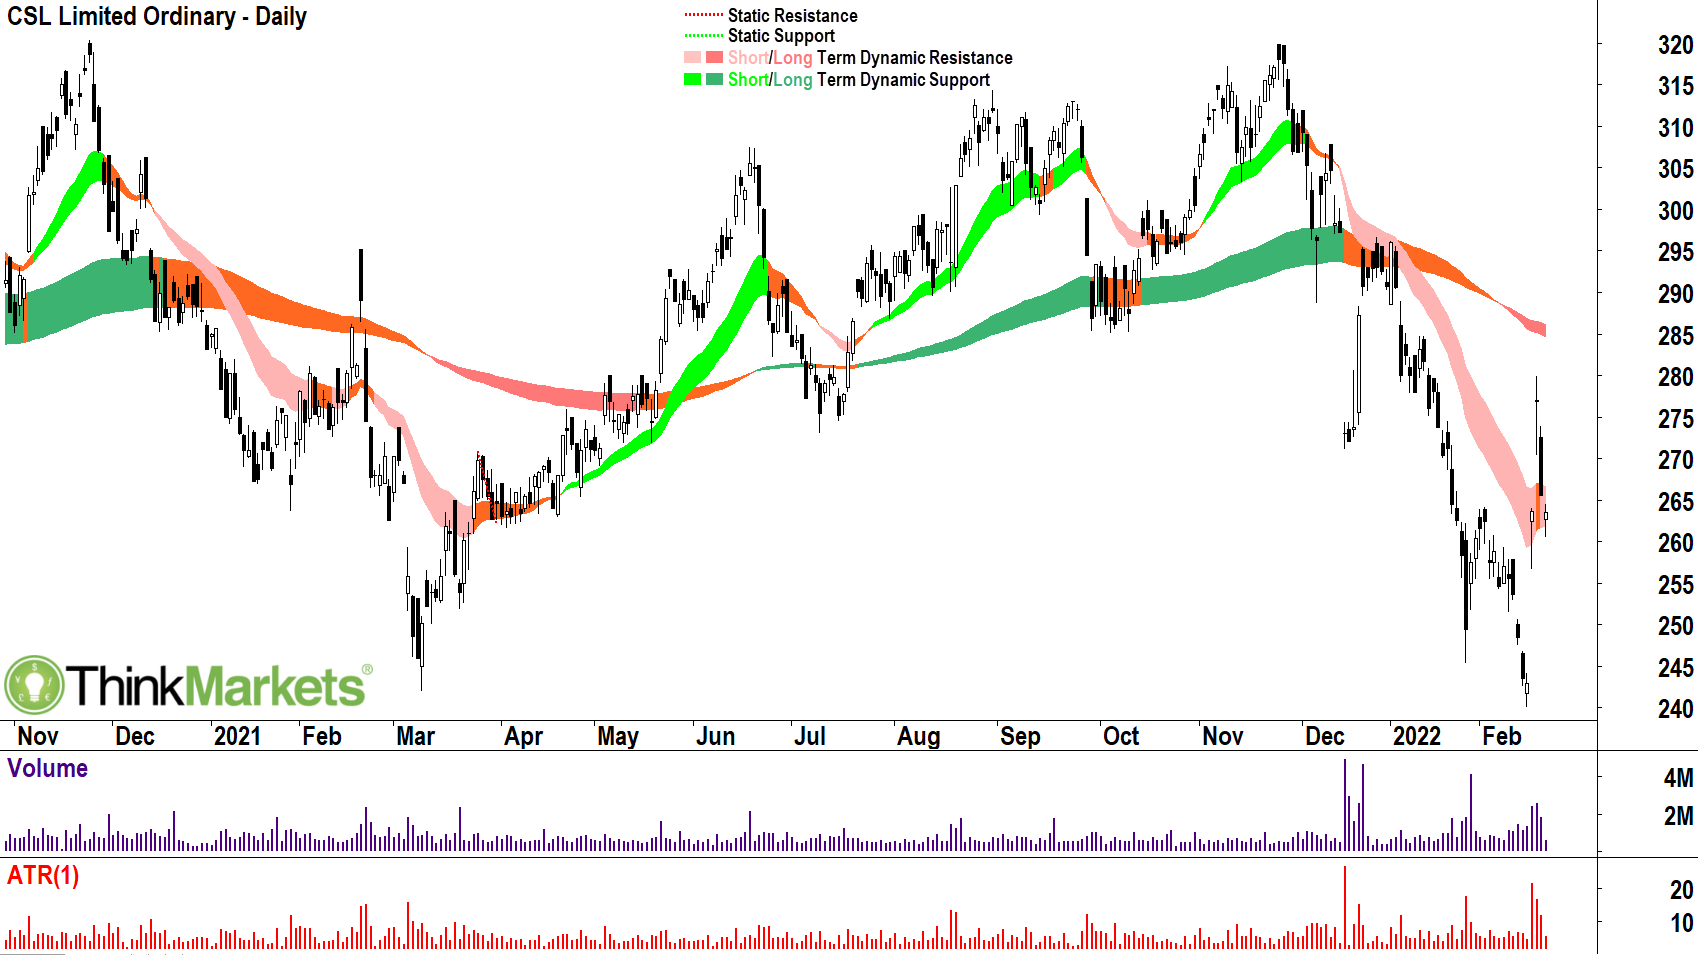
This chart is far from what we typically look for in a potential BUY rating stock. We can see a clear short term downtrend (light-pink zone) and a long term trend (dark pink) that has just made the transition to down.
On the way up, the short and long term trends zones offer dynamic support to prices, acting as a "trampoline", bouncing prices back up. Unfortunately for CSL, on the way down they do the opposite, that is, they repel prices down again (imagine an upside down trampoline sitting within each zone!). It is encouraging to see the breach of the dynamic short term resistance zone, and we would like to see it hold and once again act as an upwards trampoline over the next few sessions!
The dynamic long term resistance zone between $284 and $286 is the next key potential point of supply to overcome. Then, we'd be watching potential static resistance points such as the 29 December 2021 high of $296.74. Either area could cause a fledgling rally to trip up.
On the plus side, the last peak on 17 February at $280 eclipsed the prior peak, and if we get another trough above the 15 February low of $244.30, we should be back into the bullish higher peaks and higher troughs pattern.
Other price action indicators such as a solid demand-side candle and gap on 16 February indicate that there is either some speculative buying or short covering loitering in the system. Add to this, the proximity of a key static support point from the 23 March 2020 COVID-19 low at $242.67 and the 9 March 2021 major swing low of $242, and it would not be totally surprising to see a new swing low bashed out around current prices.
Clearly, plenty of work is required to get CSL up to a BUY rating from a technical perspective. We will continue to monitor its price action for the transition to higher peaks and higher troughs, and for strong showings around the static and dynamic resistance zones. Until then, we rate CSL as a HOLD on the basis of the recent push off the major swing lows, and due to the proximity of the $242-$244 static support zone.
Valuation & Rating
Based upon our earnings and growth rate assumptions and a target PE of 33 times earnings, our fair value target for CSL is $294.50. This is down from the $310.75 fair value target from our December 12 2021 update. The reduction is due to changes to forecast earnings, and the paring back of our benchmark PE in line with the broader markets' reduced appetite for higher PE stocks. The fair value target allows for approximately 11% upside from the current price. Given its valuation, its risk profile, and its current technical picture, we are comfortable with a HOLD, MODERATE RISK rating for CSL.
Pro Medicus (PME)
Rating: AVOID-WATCH BUY, LOW RISK Price Target: $55.78 (+30%)
Business Overview
PME is a global leader in medical imaging and radiology practice information systems. The company offers customers two main systems, Visage RIS and Visage 7. PME's products facilitate greater productivity within client organisations, improving both patient and employee experience, and increasing profits.
Visage RIS (radiology information system) is a platform for managing every aspect of a radiology practice's workflow, including patient bookings, patient management through their appointment, practitioner workflow management, consult reporting, patient billing, and picture archiving and communication systems (PACS). Visage 7 is an enterprise level state-of-the-art medical imaging system that allows practitioners to view and analyse patient images using the built in AI, on sight or remotely via the cloud, and all with near-immediate access.
PME operates as a software as a service ("SaaS") model. Users pay an ongoing subscription fee rather than a large one-off upfront expense. This affords PME a low barrier to entry for prospective clients, a steady revenue stream once clients are on board, and very sticky clients. Software as a business is typically high margin because once the research and development is done, the marginal cost of adding another user is relatively little compared to non-software related businesses.
Unlike CSL, PME had relatively fewer issues arising from the pandemic given that radiology practices, which were classified as essential services in Australia, continued to operate with only modest impact on turnover. Indeed, one could argue based upon the company's recent results, the pandemic may have even enhanced their point of difference over competitors. For example, much of the point of Visage is that it allows doctors to seamlessly work from anywhere, home or office — which is particularly handy during a pandemic. Also as a SaaS business, rolling out their products to new customers has shown to be just effective via remote methods (e.g. Zoom calls), compared to traditional on-site visits.
Indeed, in the interim report discussed below, PME CEO Dr Sam Hupert noted the company’s operations had not been hampered by the pandemic: "Our pipeline remains strong with a good spread of opportunities in different markets. Many are Cloud-based – a trend gathering significant momentum – and many are interested in more than one of our Visage solutions."
Interim Results
PME's interim report demonstrated continued strong revenue growth, up 40% versus the pcp, and in NPAT which increased 52%. Half-on-half revenue growth an impressive 20%. Each of the geographic regions in which PME operates reported growth. North America was the standout (revenue up 50%), but there was also an impressive performance from Europe (revenue up 39.6%), and a commendable performance in Australia (revenue up 7%).
During the first half, PME announced a $40 million 7-year contract win with Novant Health (USA), a $12 million 5-year contract renewal with Allegheny Health (USA), and a further extension of a contract with the German Government for a fourth hospital site. In terms of implementations, the company continued to make significant progress with all key implementations being on track or ahead of schedule.
Perhaps the most impressive point we extracted from PME's interim results was the increase in EBIT margin from 63% to 66%. Margins this strong and growing demonstrate management is well on top of the key cost and revenue pressure points within the business. The improvement came on the back of price increases within the Allegheny renewal, and disciplined cost controls within a difficult labour and supply chain environment.
Finally, we note continued growth in operating cash flows, which grew 58% to $27 million. Strong operating cash flow enables a business to reinvest in its growth quickly and cheaply compared to trying to source equity or debt funding. Further, it facilitates the payment of dividends, and on this point, PME increased its interim dividend to 10 cents per share.
Broker Consensus & Financials
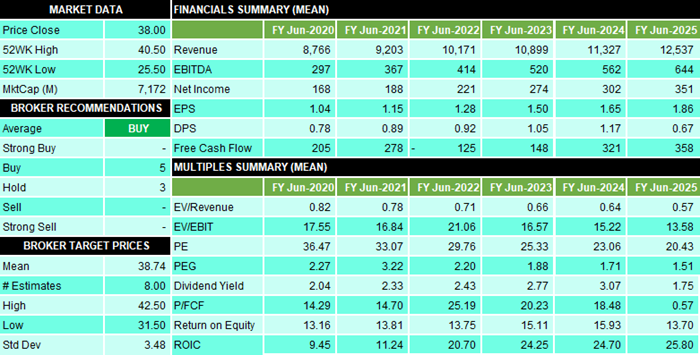
There are 7 brokers on record for PME at the moment. 1 is at a "Strong Buy", 4 are at a "Buy", 1 is at a "Hold", and 1 is at a "Sell". The brokers' average price target is $54.97, the lowest price target is $44.80, and the highest price target is $61.79. The average price target is approximately 27% above the current share price.
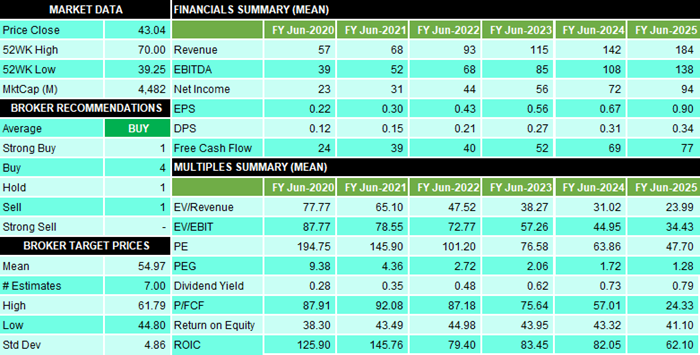
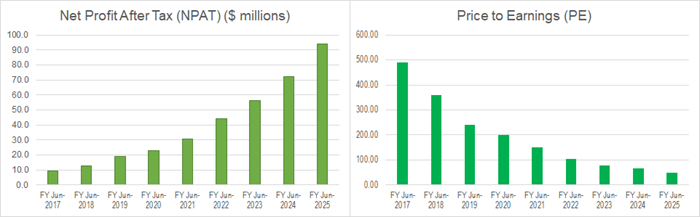
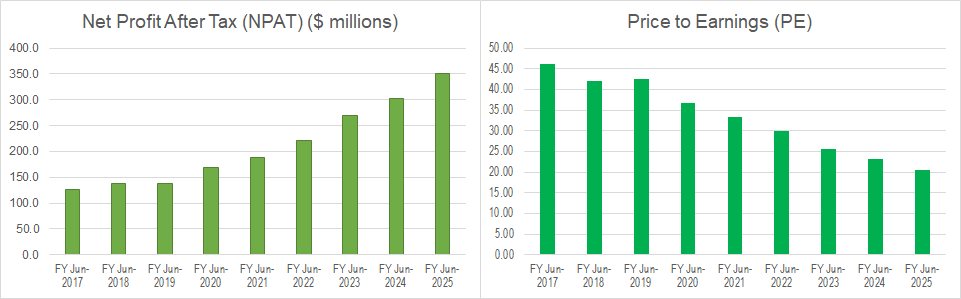
Above, we discussed CSL's history as a "high-PE-high growth" stock. Well, looking at the above numbers, one could view PME as CSL on steroids (not another medical pun!). FYI, its PE in FY2017 was a staggering 478, in FY18 it was mind-blowing 352, in FY19 it was a whopping 235, in FY20 it plunged to a lofty 195, and in FY21 it was an eye-watering 146 times earnings.
Now, if you simply picked your stocks on the basis that each candidate must have "a low PE", you wouldn't have gone anywhere near PME over the last 5 years. And that would be a shame for you! In 2017, PME was trading at just over $4 a share compared to the current price of around $43 a share (it peaked at $70 in 2021!). Once again we can see a perfect example of how investors who are hungry for earnings growth factor it into their valuation equations. They understand that a high PE today doesn't necessarily mean a high PE tomorrow.
Having noted the above, PME's FY22 PE of 101 is still a doosy! Growth? About double that of CSL, around a 30% per annum average out to FY25. Impressive. It's also sufficient to drop PME's FY23 PE to 77, to 64 in FY24, and potentially as low 48 in FY25. The question is whether paying 48 times earnings three years out is a good deal or not?
Our view is that it's getting close. Valuation, like beauty, is in the eye of the beholder. It really depends on what you're prepared to pay today to participate in the growth down the track. You're also expecting that growth will be sufficient beyond that period to warrant other market participants paying similar multiples to when you entered — giving you a win in price.
Some investors have a higher risk tolerance, and therefore they set a lower benchmark PE to compare new prospects against. Conversely, investors with higher risk tolerance will opt for higher benchmark PEs. In considering our benchmark PE for any stock, we take into historical PE's (i.e., what the market has been comfortable paying for in the past), and consensus PE's for current FY plus the next three FY's (i.e., what the market is likely to pay in the future).
In deriving our fair value target, we used a benchmark PE of 70 times earnings. This is the median PE of the broker estimates for our outlook period. We feel this best represents what that market believes is the appropriate PE for PME going forwards. But! We know a PE of 70 might "feel" way too expensive for some investors. With this in mind, we reworked PME's fair value target using a benchmark PE of 60 ($47.66), of 50 ($39.72), and of 40 times earnings ($31.77).
Regardless of which benchmark PE you use, we believe that PME is hands down one of the best quality stocks on the ASX — it's a stock you want to own — eventually. Regardless of what you consider a reasonable valuation for PME, hopefully we've given you some great price-points to work with to assess when might be the right price to add it to your portfolio. As for the execution risk associated with PME achieving our forecast earnings and growth forecasts, we've gone with "LOW".
Technical Analysis
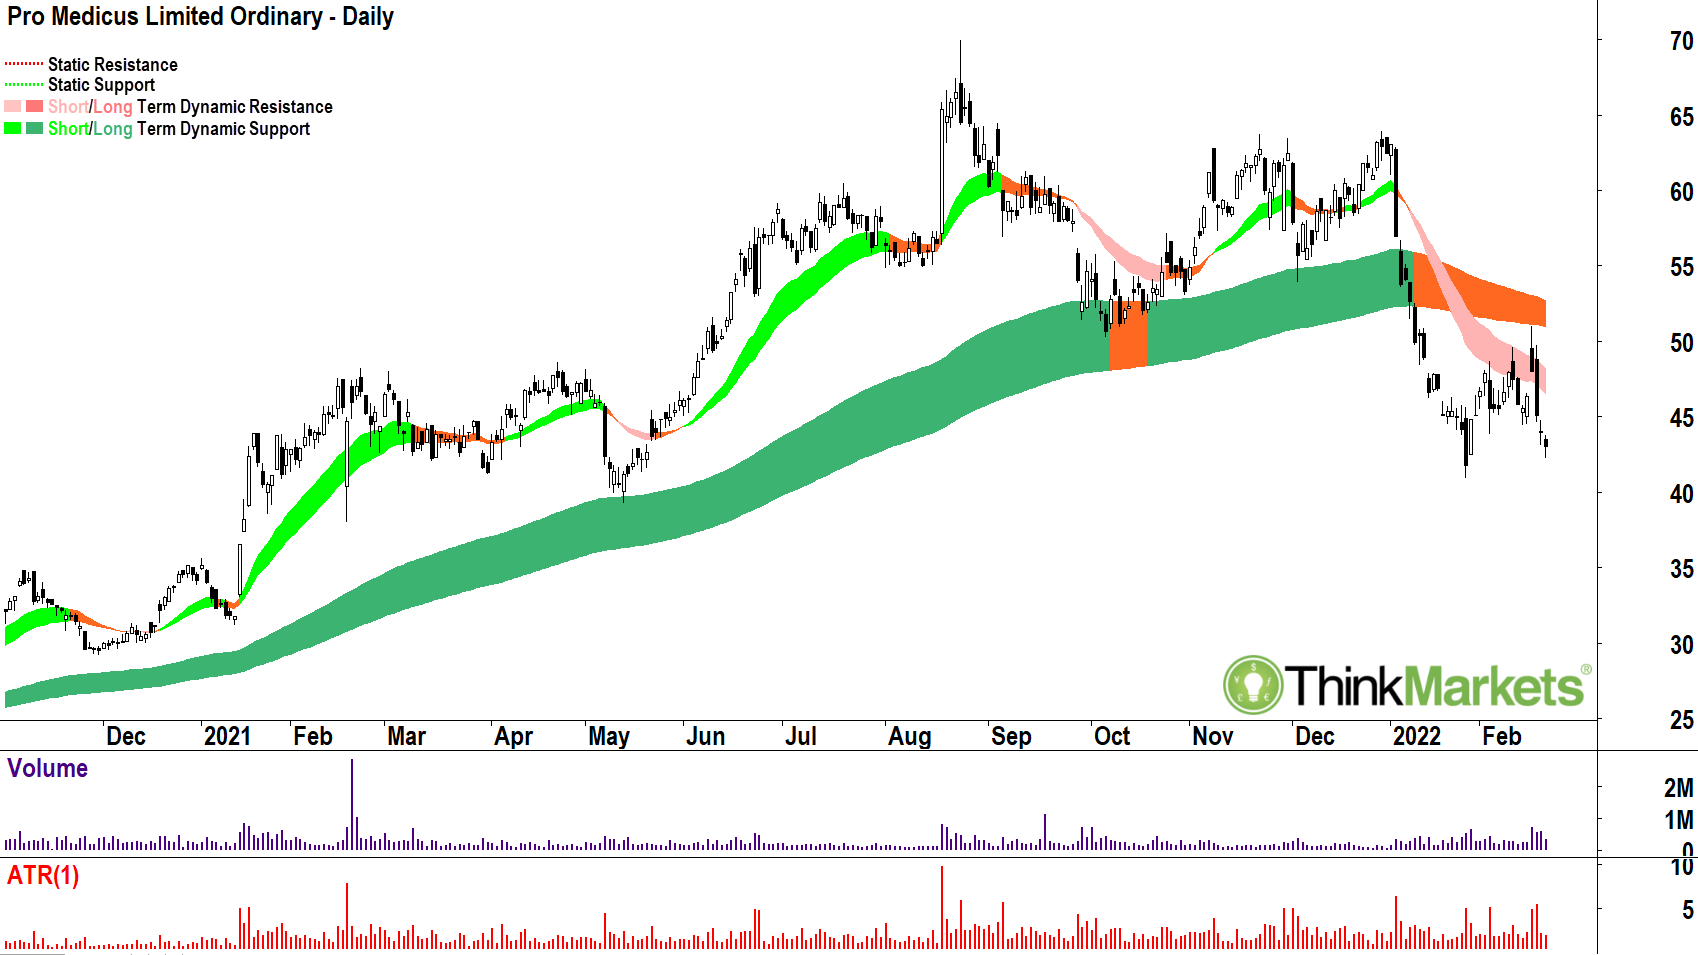
This is another chart which appears to be under substantial and building selling pressure. We can see a clear short term downtrend/dynamic short term resistance zone (light-pink zone). Also, the long term trend/dynamic long term resistance zone (dark orange) is in a well-advanced transition from up to down.
The price has just been repelled lower out of both the dynamic short term and long term resistance zones. Indeed, check the 16 February candle to see just how close the price came to the dynamic long term resistance zone before failing.
The price action shows that potential demand at the last trough on 14 February at $44.42, and the second last trough on 3 February at $43.86, has evaporated. As a result, we may well transition back into the bearish lower peaks and lower troughs pattern.
Other price action indicators, such as very strong supply-side candles on 16 and 17 February, indicate there is concerted sell the rally activity in the system. This is concerning. The proximity of a key static support point from the 27 January low at $40.94 probably won't give holders too much comfort, and if it breaks, the next major static support is not until the 13 May 2021 low of $39.25, and then the 17 February 2021 low of $38. We do expect a band of support between these lows and the 23 October 2020 high of $34.81 could provide a potential turnaround point for the current downtrend.
Clearly, plenty of work is required to get PME to a BUY rating from a technical perspective. We will continue to monitor its price action for the transition to higher peaks and higher troughs, and for strong showings around the static and dynamic resistance zones on the way back up. On the way down, we'd be watching closely for a rally from $40.94, or failing this, from between $34.81 and $38. Until then, we rate PME as an AVOID on the basis of the precarious nature of the current technicals.
Valuation & Rating
The PME chart reflects the dramatic shift in sentiment towards high-PE-high-growth stocks since November last year. Investors have reeled in what they consider to be an attractive forward multiple. To put it into perspective, the 1-year forward PE for the ASX200 Information Technology Sector Index peaked at 74 time earnings on November 22 2021. Today, it's just 35. (FYI, Healthcare Sector has dropped from 39 to 30.)
Based upon our earnings and growth rate assumptions and a target PE of 70 times earnings, our fair value target for PME is $55.78. This is down from the $76.04 fair value target from our November 22 2021 update. The reduction is due to changes to forecast earnings, and (mainly) the paring back of our benchmark PE in line with the broader markets' reduced appetite for higher PE stocks.
The fair value target allows for approximately 30% upside from the current price. Given its valuation and its risk profile, we would ordinarily be considering a BUY, LOW RISK rating for PME. However, due to its current technical picture, we must go with an AVOID/WATCH BUY for now.
EBOS Group (EBO)
Rating: BUY, LOW RISK Price Target: $40.10 (+5%)
Business Overview
EBO is Australia's largest and most diversified marketer, wholesaler and distributor of healthcare, medical and pharmaceutical (HMP) products. It also has a significant exposure to animal care products with both wholesale and retail operations across Australia and New Zealand.
EBO's HMP business has a two-pronged focussed. Firstly, it sells, services, and supports a range of medical equipment, including diagnostic equipment, practice equipment, and medical instruments. Secondly, it sells and distributes a wide range of consumable supplies, including infection prevention solutions, wound-care, and pharmaceuticals.
To give you an idea of EBO's dominant position in HMP wholesale and distribution, it has over 35,000 active products, more than 1,000 global suppliers, and is the key service provider to most of Australia's hospitals, day surgeries, general practices, and aged care facilities. It's the exclusive third party distributor of pharmaceutical products to more than 400 Chemist Warehouse and My Chemist stores in Australia, and as a nice kicker, it wholly owns the TerryWhite Chemmart pharmacy network. Talk about scale!
Given that the business is so focussed on essential services and products, it has proven to be practically pandemic-proof. If anything, the massive increase in consumables within the healthcare sector in response to COVID-19 has seen EBO continue its pre-pandemic earnings growth with solid improvements in NPAT logged in both FY20 and FY21.
Indeed, it's rare to get a combination of defensive and growth, but EBO certainly appears to fit this bill. Looking forward, profits should be further boosted by sticky-high levels of consumables use, a pick up in elective surgeries, and plans to open another 150 Chemist Warehouse stores and another 175 TerryWhite Chemmart stores in the longer-term.
Interim Results
EBO delivered another solid performance in the half-year ending December 31. HMP underlying earnings were up 17% versus the pcp, whilst Animal Care was up 15%. Group NPAT rose 16% to $110 million on an 8% increase in operating cash flow. Return on capital employed (ROCE), a measure of how efficiently a company deploys its capital, was 18.2% — a record for the Group.
The only key financial metric that went in the wrong direction was net debt to earnings before interest, tax, depreciation and amortisation (EBITDA). Because we are dividing debt by earnings, you'd prefer less of the former and more of the latter (i.e., a lower ratio). EBO's Net Debt/EBITDA ratio increased from 1.0 to 1.28 for the half. Given that we'd only begin to consider ratios greater than 2 as concerning, we're not too fussed with this development. The increase is mainly to do with EBO's December acquisition of LifeHealthcare which we believe is going to add massive value to the group.
Digging into the divisions, HMP benefited from solid customer and market share growth in pharmacies as consumers continued to respond to the pandemic (think vaccine roll out and purchase of RAT kits!). TerryWhite in particular saw above market growth sales as it delivered nearly a quarter of Australia's pharmacy-based vaccinations. Sales to healthcare providers were also strong on continued high demand for PPE. Logistics revenue was also boosted by PPE demand and the distribution of RAT kits. EBO is planning on building another distribution centre in Sydney to keep up. Finally, Animal care enjoyed strong earnings growth as we continued to love our pets even more during the pandemic (Rover: Walkies…again!?).
Broker Consensus & Financials
There are 8 brokers on record for EBO at the moment. 5 are at a "Buy" and 3 are at a "Hold". Again, it's encouraging to not see any brokers at a "Sell" or "Strong Sell". The brokers' average price target is $38.20, the lowest price target is $31.50, and the highest price target is $42.50. The average price target is almost spot on with the current share price.
It has been interesting to review two other top quality, high-PE-high-growth companies in CSL and PME. So, how does EBO stack up? High growth? Check, we're forecasting earnings growth of 13% per annum average out to FY25. Order of magnitude — this is roughly twice the market average.
High PE? Well, at 30 times FY22 (current year's) earnings it's comfortably below CSL's 32 and well below PME's 78. Looking forward, and trying to balance growth versus value, if our assumptions for each of the three companies are correct, then EBO will end up with the lowest PE of the trio by FY25 (20.5). It also has the highest expected average dividend yield of the three out to FY25 at around 2.7% per annum, franked at 96%.
As far as the execution risk associated with PME achieving our forecast earnings and growth forecasts, we rate this as "LOW". Here we cite the defensive nature of EBO's earnings and the conservatism of our estimates. Still, there are risks with any investment, and of course with any company as exposed to the pandemic as EBO is. Certainly, EBO has revelled in the chaos COVID-19 has wreaked on the local and global economies.
Does this mean that a return to normal would therefore be detrimental to EBO? We've considered this, and our view is that: 1. since 2020, any attempt to define "normal" has proven to be a pointless exercise, and 2. the pandemic is more likely than not to continue to provide tailwinds for EBO — at least in the medium term.
Technical Analysis
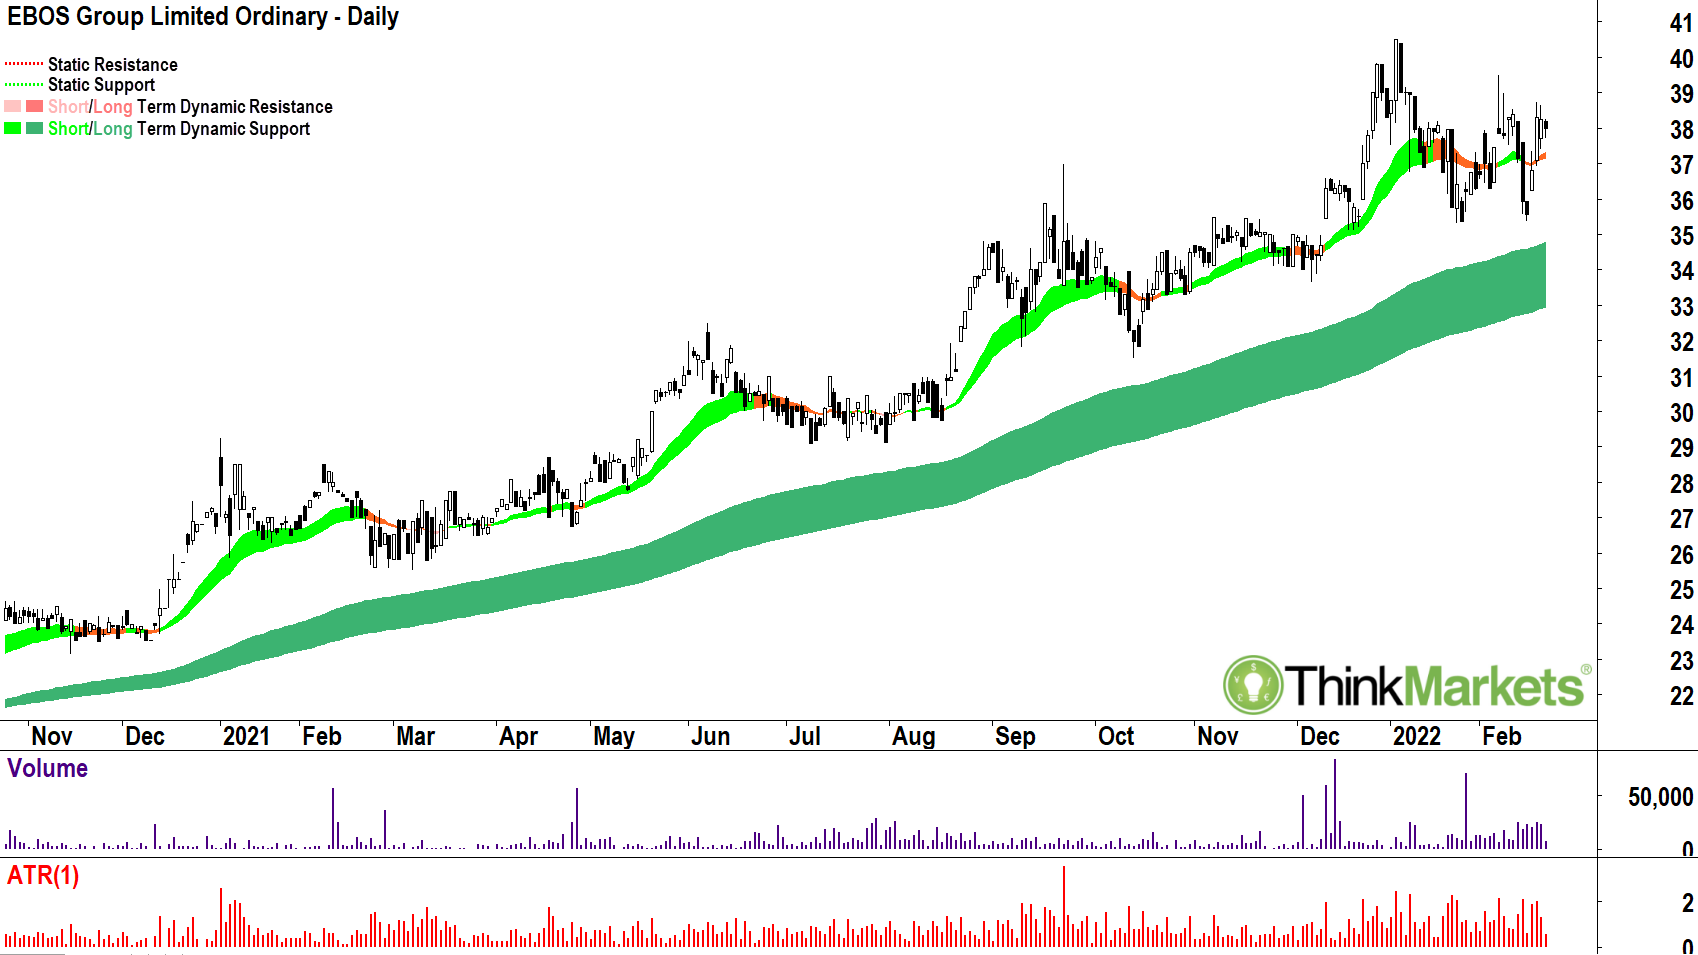
What's this? A chart that's bottom left-top right!? Who would have thought!? Two things here. First, great, that's the epitome of excess demand and of a buy the dip mentality among investors for EBO. But, wasn't PME also bottom left-top right before it reversed course? Well, yes it was. But that's the nature of the beast — trends change! As technical analysts, we can only call it as we see it right now and be attentive of any signals that the balance (or imbalance) between demand and supply is changing.
The EBO chart does look very solid. It has a very well established long term uptrend. The short term uptrend has flattened out though, but it does seem to be offering some dynamic support to prices for the time being. There's nothing sinister in the volume or volatility indicators to suggest that the long term trend can't continue.
The short term price action is good, not great. Since the 5 January peak of $40.50 we are flattening out. However, it is not uncommon for strong uptrends to flatten out around a key round number like $40. Often, it's just a case of removing the dead wood who is waiting to take profits here — for no other reason but the fact EBO's price hit a psychological target for them. If the valuation remains attractive, investors allocating capital based upon value and not simply a number, will eventually clear this supply and bump prices higher.
We are watching some pesky supply-side candles from the January peak, and also from the failed retest of the peak on 7 and 8 February. However, we are encouraged by the strong showings in the candles on 16 and 17 February. Indeed EBO appears to be weathering the broader market storm very well.
In summary, this is a solid chart. 8 out of 10 perhaps? There are some issues as we've identified, but these are not enough to dissuade us from going with a BUY rating for EBO from a technical perspective.
Valuation & Rating
Based upon our earnings and growth rate assumptions and a target PE of 25 times earnings, our fair value target for EBO is $40.10. The fair value target allows for approximately 5% upside from the current price. Given its valuation, its risk profile, and its current technical picture, we are comfortable with a BUY, LOW RISK rating for EBO.
Any opinions, news, research, analyses, prices or other information contained on this website is provided as general market commentary and does not constitute investment advice. ThinkMarkets will not accept liability for any loss or damage including, without limitation, to any loss of profit which may arise directly or indirectly from use of or reliance on such information.