(Source: AusbizTV, "The Trade: The ABC's of technical analysis", Feb 24 2021. Available from: https://www.ausbiz.com.au/media/the-trade-the-abcs-of-technical-analysis-?videoId=7459)
The building blocks of technical analysis
One of the most basic, but most important technical analysis concepts is that of support and resistance. If you wish to master the art of technical analysis, you absolutely must have a sound grasp of this concept. This article aims to provide you with a simple, but one hundred per cent explicit methodology to identify support and resistance levels on any chart.
As the names suggest, support tends to be an area on the chart where the price of a security struggles to move below. Depending on the significance of support at a price level, the price will usually slow its fall, stagnate, or potentially bounce as it approaches/reaches the level. Resistance on the other hand, tends to be an area on the chart where the price of a security struggles to move above. Depending on the significance of resistance at a price level, the price will usually slow its rise, stagnate, or potentially fall as it approaches/reaches the level.
Even the stock market has a memory
That's what happens at support and resistance, but the obvious question is: Why? Most technical analysts believe that the market has a memory. This is because the market is made up by investors like you and I, and of course, we have a memory! We remember when we bought at the top of a price move. That hurts when the price has fallen back down again and we're sitting on losses. We curse our rotten luck and promise ourselves that if the price ever gets back to the point where we got in, we'll sell out immediately and never trade like that again!
There's a good chance we got into the stock because it was looking like going to the moon at the time! There's also a good chance that many others fell for the same buy signals we did, and are also stuck in at higher prices. Some (many?) may also wish to exit if the price gets back to our buy level. Selling is another word for supply. All of this pent up supply at the recent high is likely to impede any price rise back to the high. That's resistance. The strength of resistance at a recent high price depends upon how many investors wish to exit there, and upon the quantity of stock they hold.
Support forms in a similar fashion, but it is a result of investors regretting selling at a particular level. We've all done it, "Darn, that thing went down like a stone as soon as I got in, I just sold at the absolute bottom, and now it's going straight back up again!". Once again, many other investors probably also followed the market signals you were watching and jumped out at the lows. Like you, they may wish to buy back if the price falls back to that level to eliminate what they now perceive to be a mistake. That's support. The strength of support at a recent low price depends upon how many investors wish to enter there, and upon the quantity of cash they hold.
Load up your charts! Let's spot 'em
So that's what support and resistance zones are and how they form. The next question is: How do we spot them on a chart? This process starts with identifying which price levels qualify as a significant enough recent high and a significant enough recent low. Let's refer to a qualifying recent high as a peak, and a qualifying recent low as a trough.
We define a minor peak as the highest point between a short term uptrend and a short term downtrend. A short term uptrend is simply any two consecutive periods on the chart (this could be 5 minutes, hourly, days, weeks, months etc.) where the latter period's high is higher than the earlier period's high, and the latter period's low is higher than the earlier period's low. A short term downtrend is just the opposite, two consecutive periods with lower highs and lower lows. A minor trough is just the opposite of a minor peak. It's the lowest point between a short term downtrend and a short term uptrend.
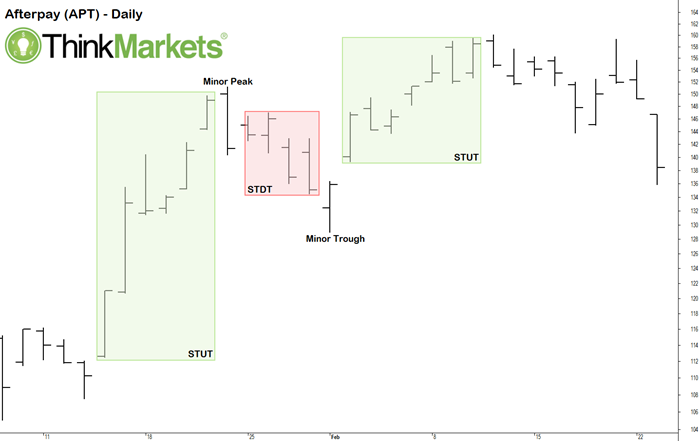
So, minor peaks and minor troughs should be easy enough to spot on any chart, as you're simply comparing the highs and lows of various periods. They’re even easier to see when we draw lines to link up the short term trends. The minor peaks and troughs just pop out. The peaks are the pointy bits points up, and the troughs are the pointy bits pointing down!
Each minor peak and minor trough represents a price level where we can expect some degree of future resistance and future support respectively. We'll call these minor resistance and minor support levels. If there's a minor, there's probably a major as well! So, how do we spot major support and major resistance levels on a chart?
Let's define a major peak as a minor peak that has lower minor peaks on either side of it. So, a major peak stands out above each of its neighbouring minor peaks. We should expect that a major peak is going to equate to major resistance should the price get back up there. Think about it, the price failed to go past this level three times in a relatively short period of time. There's probably going to be a bunch of investors who want to undo their buying mistakes by selling out around that major peak. This equals selling, which therefore equals resistance.
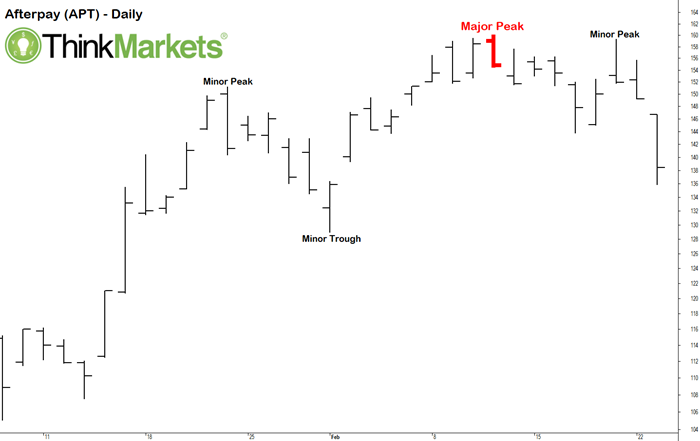
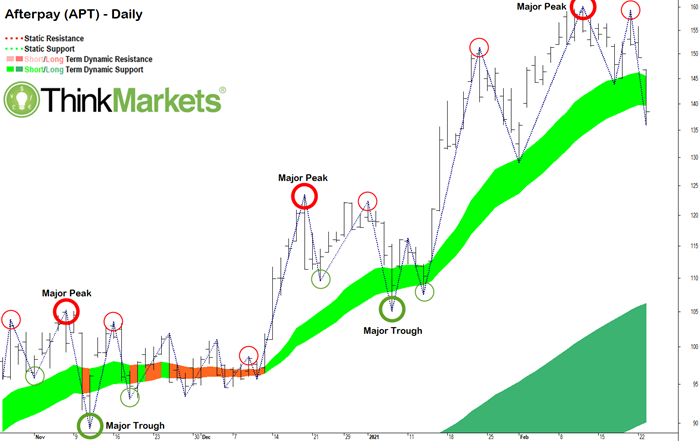
A major trough is just a major peak turned upside down. It's the minor peak that has higher minor peaks on either side of it. It stands out below each of its neighbouring minor peaks, and represents a level of potential major support should the price get back down there. In our case study today we have used well known buy now, pay later company Afterpay (APT). Lets start by identifying each of the major peaks and major troughs on the chart.
Next we convert these to major support and major resistance levels (chart below). We can see that a major resistance level has formed on 11 February 2021 at $160.05. If the price was to move back up to this level, we would expect supply to enter the market to at least slow the price appreciation. If there is sufficient supply, the price may even fall back from this level. The next major support level is at the 18 December 2020 high of $123.40. If the price was to fall back down to this level, we would expect demand to enter the market to at least slow the price depreciation. If there is sufficiently demand, the price may even bounce from this level.
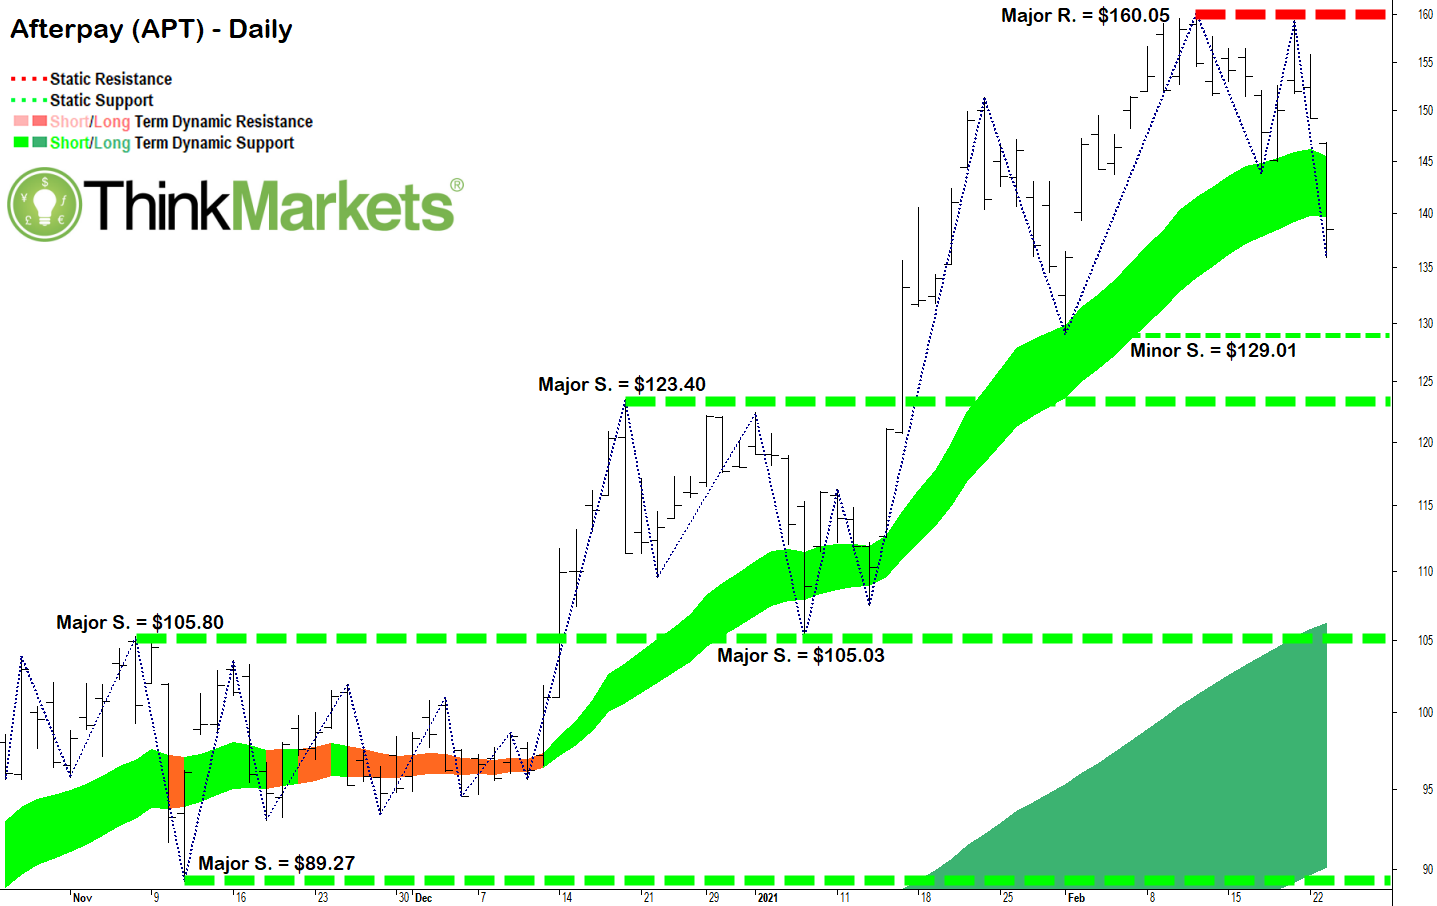
Note other major support levels at the 7 January 2021 major trough at $105.03, and the 20 October 2020 major peak at $105.80. It is no coincidence that these major support levels are so close together in terms of their price. We often find that previous major resistance levels tend to act as future major support levels and vice-versa (the market has a memory!) Also, we find that previous major support/resistance levels tend to behave as future major support/resistance levels. By understanding these phenomena, we can develop our trading systems to take advantage of potential price moves in a consistent and calculated way. This is a very good thing.
Go on, get spotting!
Now we can spot both minor and major support and resistance levels on the chart, precisely, and without confusion. So, break out the charts of your favourite stocks and start drawing in those major support and resistance levels!
Any opinions, news, research, analyses, prices or other information contained on this website is provided as general market commentary and does not constitute investment advice. ThinkMarkets will not accept liability for any loss or damage including, without limitation, to any loss of profit which may arise directly or indirectly from use of or reliance on such information.

Learn and earn more today.
Visit our Education Centre