Macro, Micro, Crypto is your Friday flick through the emerging themes impacting key global financial markets. We start big, then drill it down, and of course catch up on what's going in the world of Crypto!
Highlights
- NASDAQ Composite (COMP)
- Russell 2000 (RUT)
- Iron Ore (Shanghai 62% y/t January Contract)
- Fortescue Metals Group (FMG)
- BHP Group (BHP)
- Mineral Resources (MIN)
- Bitcoin vs $US (BTCUSD)
- Ethereum vs $US (ETHUSD)
- Cardano vs $US (ADAUSD)
- Polygon vs $US (MATICUSD)
NASDAQ Composite (COMP)
This is no-doubt one of the all-time best uptrends. Certainly, the long term trend (dark green zone) is firmly set to "bottom left-top right". If the world is to emerge from the recent crisis in better shape, technology will be the key to repairing supply chains, meeting consumers' evolving tastes and demands, and also to increasing productivity to keep a lid on inflation.
After a better than expected third quarter reporting season, the tech-laden NASDAQ is poised to finish 2021 with a Santa-Claus rally. Seasonally, the period between December and February is very strong, and stocks generally see a gain of a few percent. The only black mark against the NASDAQ's chances comes in the form of a literal black mark...the 22nd November bearish engulfing candlestick pattern.
Such patterns are often associated with a major shift in sentiment among investors in a particular market. The trigger for Monday's sell off was the re-appointment of US Federal Reserve Chairman Jerome Powell. Markets viewed this as confirming a more hawkish Fed throughout the reopening than if the suspected "next-pick" Lael Brainard was chosen. Higher rates tend to have a greater impact on longer duration (earnings tend to be pushed further into the future) tech stocks than value and cyclical stocks.
Wednesday's rally is encouraging however, and sets a clear and important demand point on the chart. As long as the NASDAQ continues to trade above the low of this candle, which roughly coincides with the trough low from 10 November at 15543, we suggest investors continue to maintain a bullish bias on the NASDAQ.
.png.aspx)
Russell 2000 (RUT)
The RUT consists of 2,000 "smaller" capitalisation stocks listed in the US. Market capitalisations are typically around $US1-2 billion.
The RUT is often used as a gauge of the strength of the broader US stock market, and therefore of the broader US economy. Unlike its more famous counterparts, the Dow Jones Industrial Average (30 large capitalisation US companies), and the S&P500 (500 large capitalisation US companies), the Russell has spent much of 2021 in a sideways consolidation pattern.
This would suggest that the bull market in US stocks hasn't spread too far past the majors. However, we did see a promising break higher out of that consolidation zone at the start of November. After peaking at 2459, the index has pulled back however, and now sits back at the top end of the consolidation zone. Tuesday's and Wednesday's candles indicate some demand is returning to smaller capitalisation stocks, and should we see this index reclaim its highs, it would indicate a very healthy US stock market indeed.
In fact, we'd go so far to say that if the Russell 2000 begins a new phase of its long term uptrend, we are more likely to be nearer the start of this bull market than the end of it!
.png.aspx)
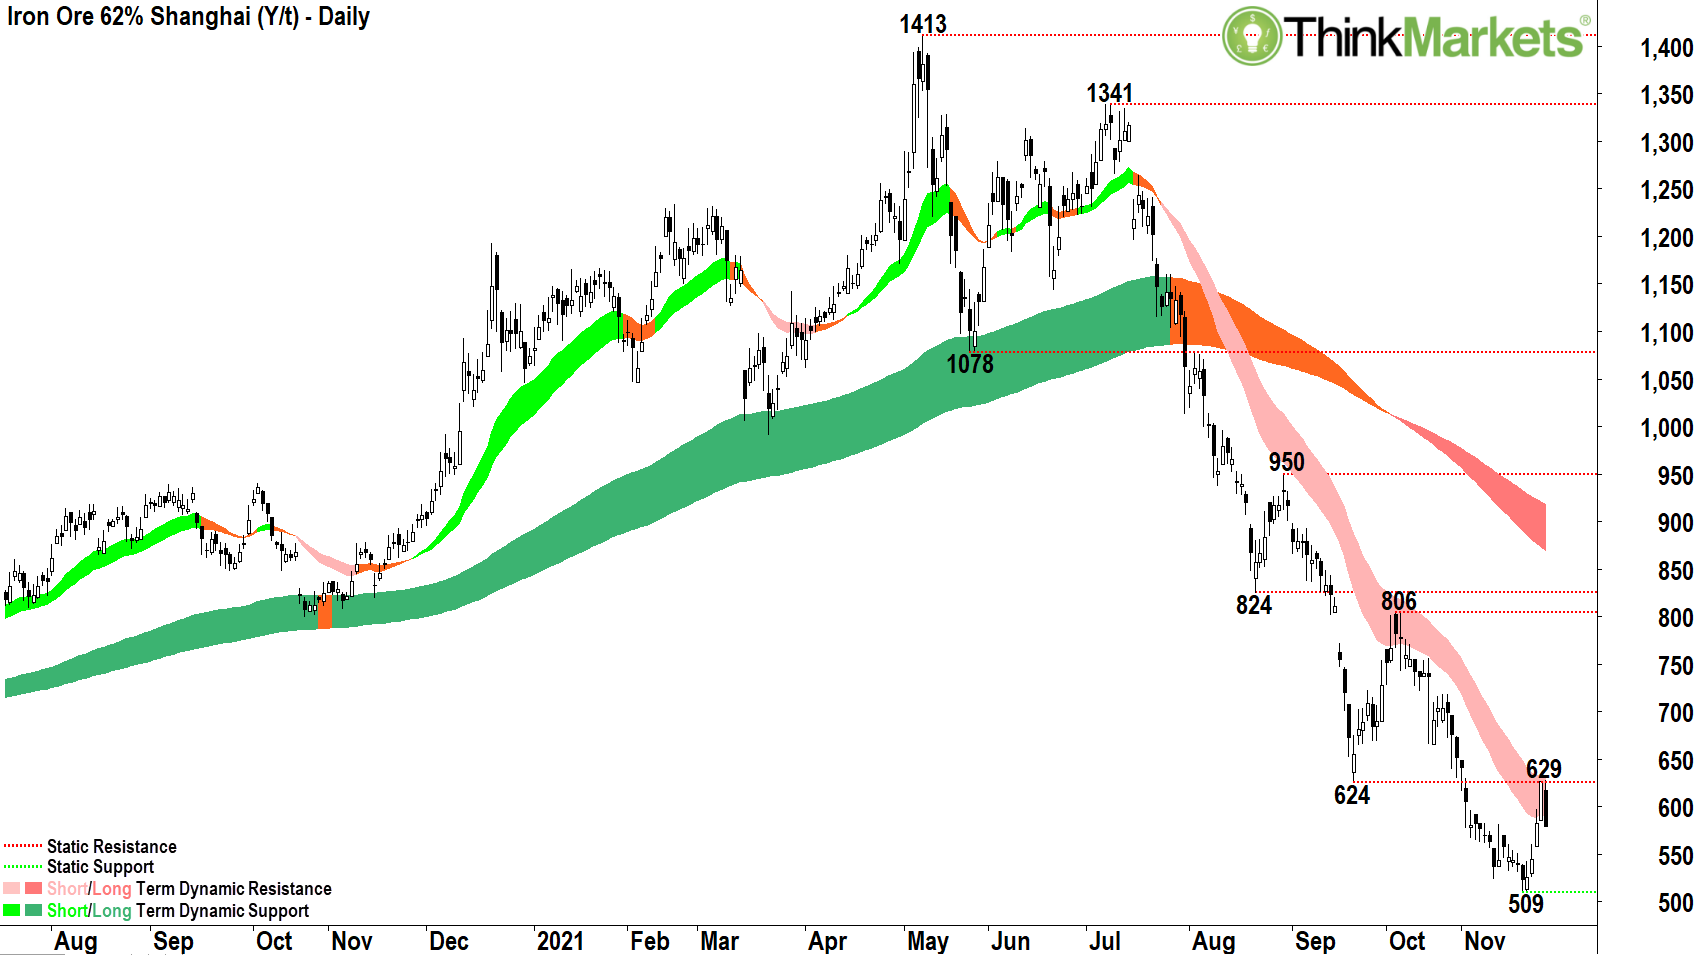
Iron Ore (Shanghai 62% y/t January Contract)
Iron ore prices have been on a rollercoaster ride in 2021. The first half of the year was characterised by an exponential upswing as supply shortages and booming steel production in China pressed the demand-supply equation for the bulk commodity firmly towards higher prices.
Then came Evergrande. China's largest property developer appeared to be teetering on the edge of collapse, certainly not a great catalyst for future steel demand in the country. At the same time, Beijing was taking steps to cool the overheating (and over polluting) steel industry in attempt to cool raw materials prices, and clear the skies above the Nation's capital ahead of February's Winter Olympics.
Down came the iron ore price. And down came our iron ore producers. Prices on the Dalian Futures Exchange in Shanghai have plunged by nearly two-thirds from their 2021 highs. BHP, RIO, FMG, have fared substantially better, as each will continue to make tidy profits even at current subdued prices, but share price falls in the order of magnitude of 20-25% have not been uncommon.
There may be a tiny glimmer of light at the end of the tunnel for our iron ore producers however. Reports from some Chinese iron ore traders indicate demand for a number of key steel products has been steadily rising over the last few weeks. This has potentially put a short term floor under the iron ore price, which has rallied from around 500 yuan/t to around 630 yuan/t at yesterday's highs.
The late-afternoon sell off back to around 585 yuan/t at the time of writing has taken some of the shine off that glimmer, but it does bode well for the start of a recovery which should build as we move towards the easing of some of the Chinese steel industry restrictions post-Olympics.
Looking at the chart below, 629 is now clearly a key level. If we get a close above that, it's going to be a big positive in moderating the current steep downtrend.
Fortescue Metals Group (FMG)
Is it an iron ore stock, or is it a green energy stock? At least we're having the conversation, and the price is benefiting from the fact it's no longer a "One-Trick Pony".
The short term trend has reversed back to the upside, putting us in the camp that FMG is definitely now a hold rather than an avoid. The support base at $13.90 is constructive, and the short term EMA's are swinging back to uptrend. Candles and price action confirm that the equilibrium has switched back to a demand-side market, at least in the short term.
We're not sure we can go so far as to calling this one a buy just yet, however. We would need to see it reconcile that long term downtrend zone which kicks in around here, and preferably hold above $16.41 on any short term pullback. But, FMG could be a speculative buy soon...We shall continue to monitor!
.png.aspx)
BHP Group (BHP)
We are witnessing a more muted rally here, and that's a concern. We would suggest investors continue to hold as long the price remains above $35.56, but it's much too early to call BHP a buy.
$39.28 is clearly an important resistance point now, and even if it does drag itself back above that price, BHP would still need push back towards that pesky LT downtrend zone (dark pink zone) before we would get too excited.
.png.aspx?width=700&height=393)
Mineral Resources (MIN)
Looks the pick out of the big iron ore miners, and it also has substantial lithium exposure as a bonus. The price action and candles have swung back to bull case in the short term, and compared to FMG and BHP, it is already dealing with the resistance that can generally come from a broken LT trend zone.
To be fair, that long term trend zone (dark green-orange zone) never actually switched to a downtrend, and that's encouraging. We feel confident enough in those candles to buy pullbacks here.
.png.aspx?width=700&height=393)
Bitcoin vs $US (BTCUSD)
A few things have conspired to dent Bitcoin's recent upside momentum. A few talking heads at various global regulators have jawboned potential tougher crypto regulation, the decision on the impending Mt Gox settlement re-distribution is likely to have a negative impact on supply, and there's the buy-the-rumour-sell-the-fact impact of recent Bitcoin based ETFs along with the rejection of a couple of others.
But this is all perfectly normal for BTC! It goes up until it doesn't...and then you have to work through the supply from profit takers, which usually takes a good deal of time.
During this period, it generally slips a few levels you didn't think it would, and then it pops to a new high when you least expect it!
Looking at the chart, 52,936 is clearly major support now. As in MAJOR! We wouldn't want to see it trade too far under this, although the LT uptrend support zone (dark green zone) can be a little spongy...(looking at give-or-take $50k here...)
Minor support is at 55,174. The candles and price action suggests this level it starting to look quite solid, and there's every reason it will hold.
Watch for a close above 60,000 as this might be enough to spur the #FOMO & #BTFD crowd back in. A close above 62,423 is starting to look very bullish, and we'd suggest it could trigger a very nice end of year rally.
.png.aspx)
Ethereum vs $US (ETHUSD)
This one still looks the better pick of the Top 2. In fact, whilst ETH has rallied an impressive 18% since its mid-October low, it's up a telling 30% against rival Bitcoin. Indeed, ETHBTC is now nudging back towards the 3-year highs set in May. The base pattern on that chart is massive, and could signal a major period of ETH ascendency is on the horizon.
The key to this ascendency is the fact that DeFi on Ethereum continues to grow at rates that make the normal economy look totally mundane. To put it into perspective, there was approximately US$20 billion total value locked (TVL) in DeFi projects on the Ethereum blockchain on January 1, 2021. That figure is closer to US$180 billion today.
It would be foolish to argue that DeFi isn't at the dawn of both its potential and wider spread adoption, and despite its clear deficiencies and challenges Ethereum is still the incumbent.
.png.aspx?width=700&height=393)
Cardano vs $US (ADAUSD)
Going the other way, and perhaps padding ETH's gains, is the woeful ADA. There was great hype and hope around Alonzo's upgrade back in August and September. This of course, was the much anticipated upgrade to Cardano which would enable it to accommodate smart contracts, therefore launching it into DeFi. It was supposed to be the paradigm shift for ADA.
It wasn't / hasn't / at least not yet. A number of promising projects developing on Cardano are yet to either launch, or if they have, are yet to gain major traction. One thing is for sure, the expected boom in TVL on Cardano hasn't materialised yet. This doesn't mean it won't, but crypto traders have very short attention spans, and ADA continues to wane.
Not helping, broker eToro announced that it would be pulling Cardano from its platform due to "business-related considerations in the evolving regulatory environment". The company provided no further details around what their concerns regarding Cardano were, and Cardano founder Charles Hoskinson was left bewildered by the move.
The chart shows we are yet to see anything which resembles a meaningful low for ADA. Without a significant white candle / long lower shadow, and preferably on some significant blow-off volume, it's hard to see anything but a slow trudge lower ahead. On the bright side, 1.50 is a key and major level of support. We could see something materialise if we test into that level, otherwise, it could be a continued death by a thousand cuts for ADA sufferers.
.png.aspx)
Polygon vs $US (MATICUSD)
One bright spot in the crypto majors is No 17 on the Market Capitalisation list, Polygon. This rapidly growing layer 2 protocol aims to build bridges across all of the major and emerging chains, thus facilitating transfers of assets throughout the broader crypto ecosystem. Polygon currently sits 8th on the TVL list, which appears to offer it some upside with respect to market capitalisation.
To put it into perspective, 2021 megastar Solana is at No 3 on the TVL list with US$14.5 billion (Ethereum TVL US$180 billion and Binance TVL US$19 billion are No 1 and No 2 respectively). Solana has a market capitalisation of US$63 billion. Polygon's TVL is US$5 billion (i.e., around one-third of Solana), but its a market capitalisation is just US$13 billion (i.e., around 20% of Solana).
Certainly, the chart for MATIC is picking up. We like the short term price action and candles, particularly the 25 November candle. The hold and push off 1.43-46 and the long term trend zone is also very attractive. The recent high at 2.31 is not an unreasonable target in the short term, and the 2.90 all-time high is a logical medium term target.
.png.aspx?width=700&height=393)
Any opinions, news, research, analyses, prices or other information contained on this website is provided as general market commentary and does not constitute investment advice. ThinkMarkets will not accept liability for any loss or damage including, without limitation, to any loss of profit which may arise directly or indirectly from use of or reliance on such information.