A topical look at technical analysis factors for a number of key markets, and ASX stocks of interest for 27 October.
In today's ThinkTechnical we'll take a look at the technical picture for the Bitcoin vs the US Dollar (BTCUSD), Nasdaq Composite (COMP), S&P ASX200 Share Price Index Futures (SPI), Spot Gold (USD/oz), Spot Silver (USD/oz) and West Texas Intermediate Crude Oil (USD/barrel).
Bitcoin vs US Dollar (BTCUSD)
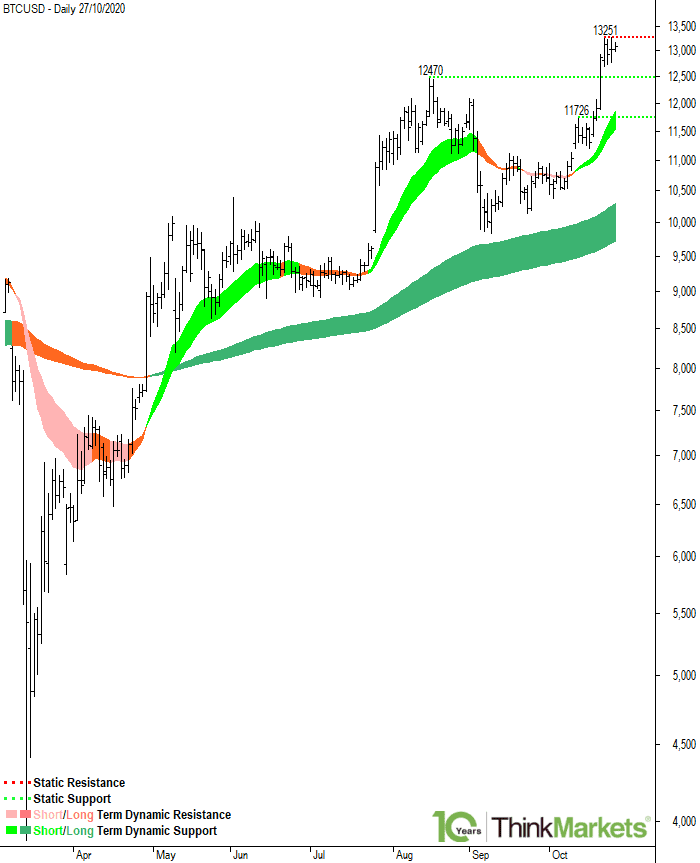
Bitcoin vs US Dollar is in a well-defined short term uptrend, as evidenced by the 21 EMA located above the 34 EMA and with each EMA rising. The long term uptrend is also well-defined, as evidenced by the 144 EMA located above the 233 EMA and with each EMA rising.
Static support will be encountered at the 17 Aug 2020 high of 12470.00, and then at the 13 Oct 2020 high of 11726.00.
Static resistance will be encountered at the 22 Oct 2020 high of 13251.00.
The dynamic short term support zone is defined by the 21-34 EMAs, projected between 11535.00 and 11855.00.
Beyond 13251.00, BTCUSD has little in the way of key price action-based static resistance points to impede upside progress. Note however, static resistance will likely be ecountered at the 15000.00 round number.
Traders may wish to buy at static support and/or within the dynamic support zones. If this cannot be achieved, then traders may have to consider buying on a breach of 13251.00.
Nasdaq Composite (COMP)
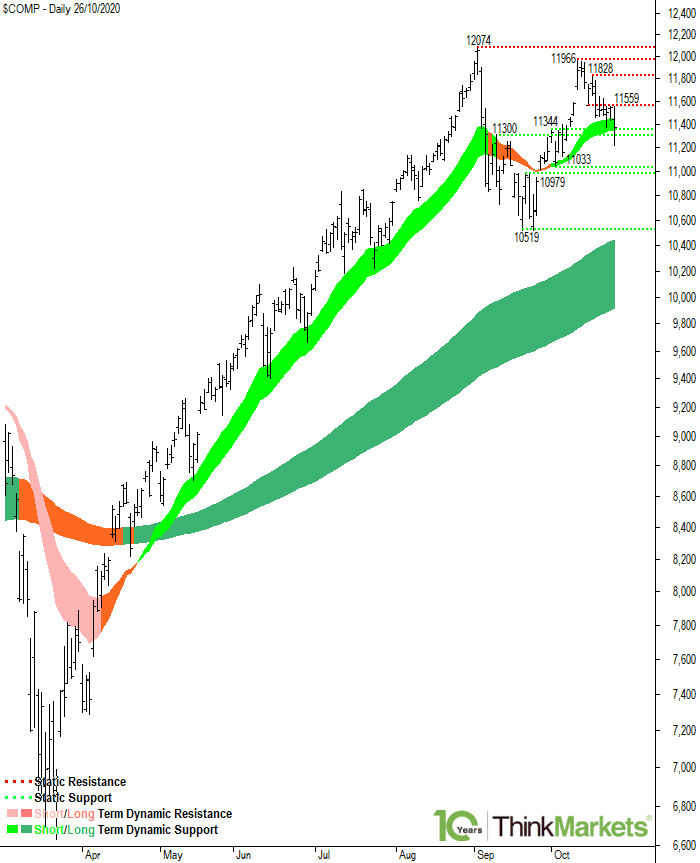
Nasdaq Composite is in a well-defined short term uptrend, as evidenced by the 21 EMA located above the 34 EMA and with each EMA rising. The long term uptrend is also well-defined, as evidenced by the 144 EMA located above the 233 EMA and with each EMA rising.
Static support will be encountered at the 01 Oct 2020 high of 11344, the 10 Sep 2020 high of 11300, and also the 02 Oct 2020 low of 11033.
Static resistance will be encountered at the 15 Oct 2020 low of 11559, the 16 Oct 2020 high of 11828, the 12 Oct 2020 high of 11966, and then at the 02 Sep 2020 high of 12074.
The dynamic short term support zone is defined by the 21-34 EMAs, projected between 11345 and 11435. since the short term uptrend began in April. This highlights the importance of this zone as a future area of potential dynamic short term support going forwards.
Targets are to the 02 Sep 2020 high of 12074. Beyond 12074, COMP is at all-time highs, and therefore targets are open ended.
Traders may wish to buy at static support and/or within the dynamic support zones.
S&P ASX200 Share Price Index Futures (SPI)
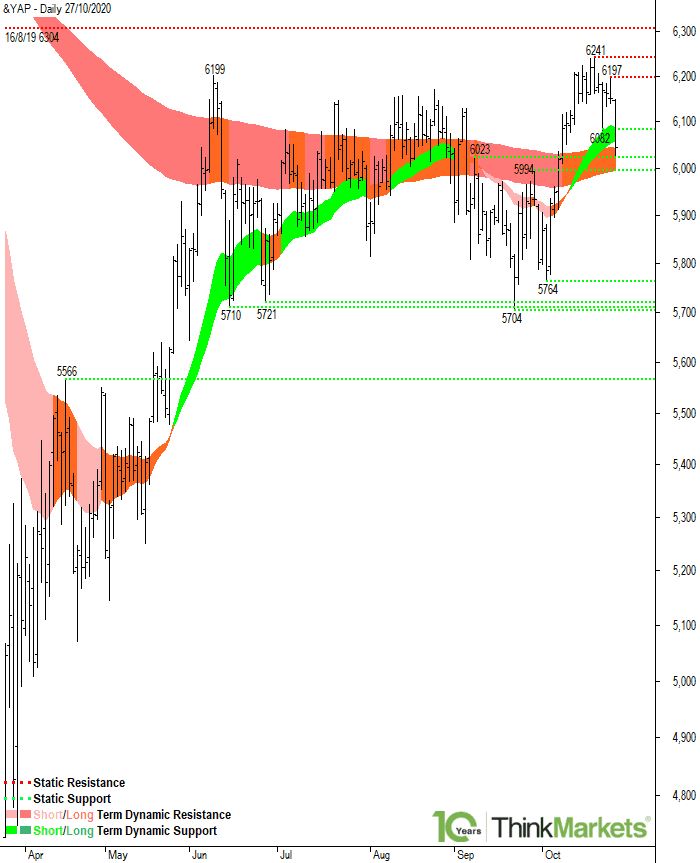
S&P ASX200 Share Price Index Futures is in a well-defined short term uptrend, as evidenced by the 21 EMA located above the 34 EMA and with each EMA rising. The long term trend is undefined, as evidenced the 144 EMA located below the 233 EMA but with each EMA rising. It is likely that these EMAs cross in the near future, therefore initiating a new long term uptrend.
Static support will be encountered at the 08 Sep 2020 high of 6023, and then at the 29 Sep 2020 high of 5994.
Static resistance will be encountered at the 26 Oct 2020 high of 6197, and then at the 20 Oct 2020 high of 6241.
The dynamic short term support zone is defined by the 21-34 EMAs, projected between 6053 and 6091. The price has been consistently rebounding higher out of the short term dynamic support zone since the short term uptrend began in October. The key issue now, is that the price is currently trading below this zone. If this situation continues, the zone may well switch from offering dynamic short term support to offering dynamic short term resistance.
The dynamic long term support zone is defined by the 21-34 EMAs, projected between 5993 and 6045. Interestingly, the price has been consistently bouncing in and out of this zone since March. The key issue now, is that the price is currently trading above this zone. If this situation continues, the zone may well switch from offering dynamic long term resistance to offering dynamic long term support.
Short term traders may wish to buy at static support and/or within the dynamic short term support zone. Given the uncertainty in relation to the long term trend, long term traders should remain neutral.
Spot Gold (US$/oz)
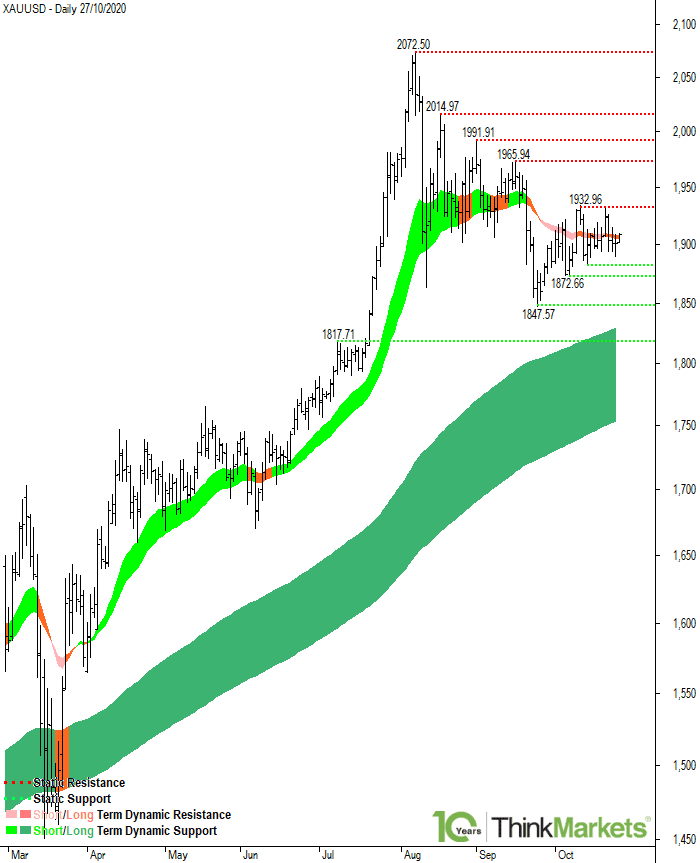
Spot Gold is in a short term downtrend, as evidenced by the 21 EMA located below the 34 EMA. The long term uptrend is well-defined, as evidenced by the 144 EMA located above the 233 EMA and with each EMA rising.
Static support will be encountered at the 06 Oct 2020 low of 1872.66, and then at the 24 Sep 2020 low of 1847.57.
Static resistance will be encountered at the 12 Oct 2020 high of 1932.96, and then at the 16 Sep 2020 high of 1965.94.
The dynamic long term support zone is defined by the 21-34 EMAs, projected between 1760.00 and 1835.00.
Given the uncertainty in relation to the short term trend, short term traders should remain neutral. Long term traders may wish to buy at static support and/or within the dynamic long term support zone.
Spot Silver (USD/barrel)
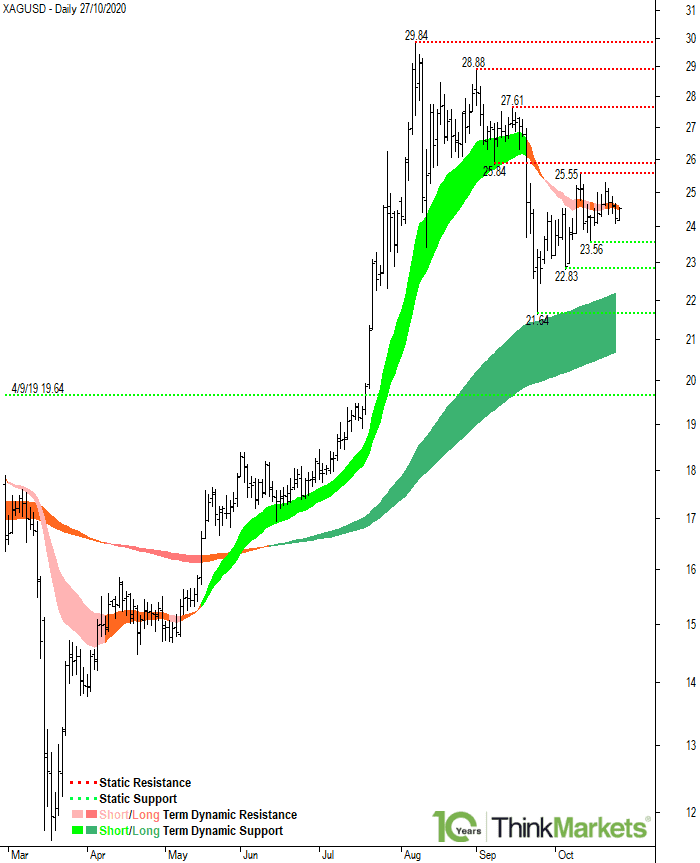
Spot Silver is in a short term downtrend, as evidenced by the 21 EMA located below the 34 EMA. The long term uptrend is well-defined, as evidenced by the 144 EMA located above the 233 EMA and with each EMA rising.
Static support will be encountered at the 15 Oct 2020 low of 23.56, the 06 Oct 2020 low of 22.83, and then at the 24 Sep 2020 low of 21.64.
Static resistance will be encountered at the 12 Oct 2020 high of 25.55, and then at the 08 Sep 2020 low of 25.84.
The dynamic long term support zone is defined by the 21-34 EMAs, projected between 20.68 and 22.17.
Given the uncertainty in relation to the short term trend, short term traders should remain neutral. Long term traders may wish to buy at static support and/or within the dynamic long term support zone.
West Texas Intermediate Crude Oil (USD/oz)
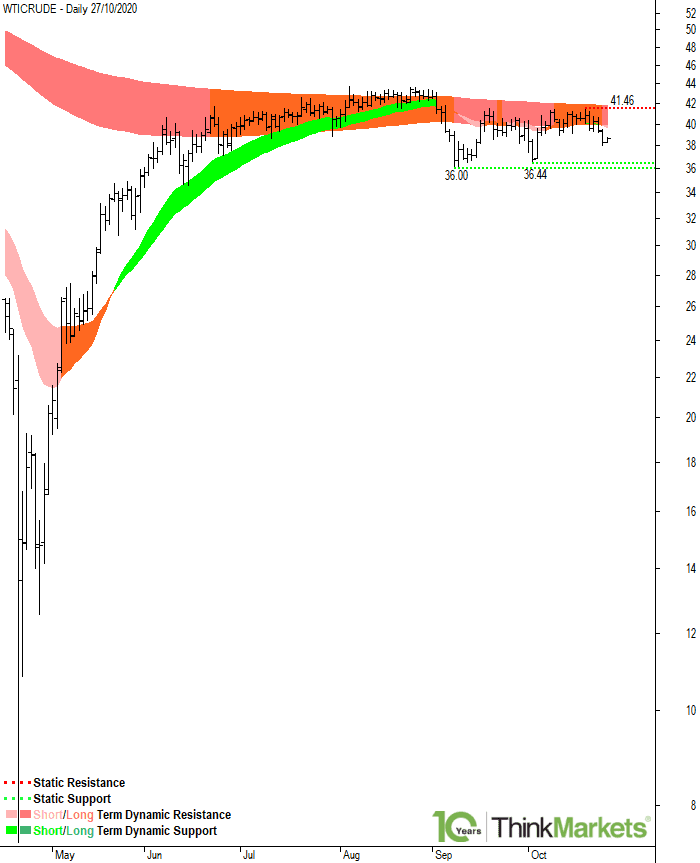
West Texas Intermediate Crude Oil is in a well-defined short term downtrend, as evidenced by the 21 EMA located below the 34 EMA and with each EMA declining. The long term downtrend is also well-defined, as evidenced by the 144 EMA located below the 233 EMA and with each EMA declining.
Static resistance will be encountered at the 20 Oct 2020 high of 41.46.
Static support will be encountered at the 02 Oct 2020 low of 36.44, and then at the 08 Sep 2020 low of 36.00.
The dynamic short term support zone is defined by the 21-34 EMAs, projected between 39.70 and 39.85. The price has been consistently rebounding lower out of the short term dynamic resistance zone since the short term downtrend began in September. This highlights the importance of this zone as a future area of potential dynamic short term resistance going forwards.
The dynamic long term resistance zone is defined by the 21-34 EMAs, projected between 39.85 and 41.70. The price has been consistently rebounding lower out of the long term dynamic resistance zone since the long term downtrend began in January. Given the long and short term dynamic resistance zones coincide, there is an increased probability of the price continuing to sell off out of this combined dynamic resistance zone.
Targets are to the 08 Sep 2020 low of 36.00. Beyond 36.00, USD/barrel has little in the way of key price action-based static support points to impede downside progress. Note however, static support will likely be ecountered at the 35.00 round number.
Traders may wish to sell at static resistance and/or within the dynamic resistance zones.