What an exciting time it is in the markets! Looking at the recent performance of the ASX 200, clearly there's a bit of a bear market rally going on! The big question is: How do you know if this is just another bear market rally, i.e., doomed to failure, or if it's the real thing – i.e., the start of the next bull market!?
 Highlights:
- Learn how to identify turning points in a stock's price
- Japanese candlestick patterns which signal trend change
- Print and save reference charts of key Japanese candlestick patterns
Bear market rallies are not unusual at all. In every bear market there are frequent bursts of demand and corresonding pullbacks in supply. Together, these scenarios facilitate hopeful bounces. Unfortunately, all but (by definition) the last bear market rally is doomed to fail!
OK smarty pants, we're in a bear market rally, but where is the supply going to come in, and where do the bears (i.e., the hedge funds who are selling big portfolios because they see worse times ahead for the global economy) put their fingerprints of supply back on the market? At what point do you go: "Oops, OK, well that's the bear market rally done. It's time for me to get out or maybe to flip to the short side"?
The 3 Pillars of Trend Change
My technical analysis methodology is firmly based upon identifying and following the trend. This is great in a rampaging bull market where everything is going up. But it's not that kind of market right now. Quite the opposite, actually, most stocks have been belted. But trends change, and that's the topic of today's discussion.
I believe there are three major "pillars" as I call them, of trend change. The first is where we're going to start today – Japanese candlesticks. These are the shortest-term technical analysis tools, really only giving us cues as to the interaction between supply and demand on a day-to-day basis.
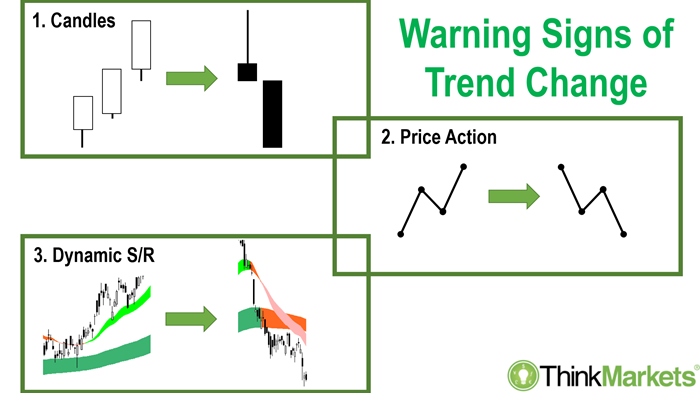
The next pillar is price action. It builds upon the candlesticks and helps identify broader patterns over days, weeks, months and even years, which indicate either the demand-side or supply side is in control of the price. Finally, there's dynamic support and resistance. This is a methodology which lends itself well to the longer-term, as simplifies greatly the identification of trends and of key levels of potential excess demand (i.e., support) or excess supply (i.e., resistance) a stock's price.
Single Candle Trend Change Patterns
Let's start our discussion of the signs we need to look for to say confidently a bear market rally is coming to an end. Cue the Japanese candlesticks! Certain Japanese candlestick patterns are very effective at telling us when a trend is about to change. The most effective of these patterns for determining when supply is entering the market, potentially causing prices to reverse course from up to down, is the "shooting star" pattern.
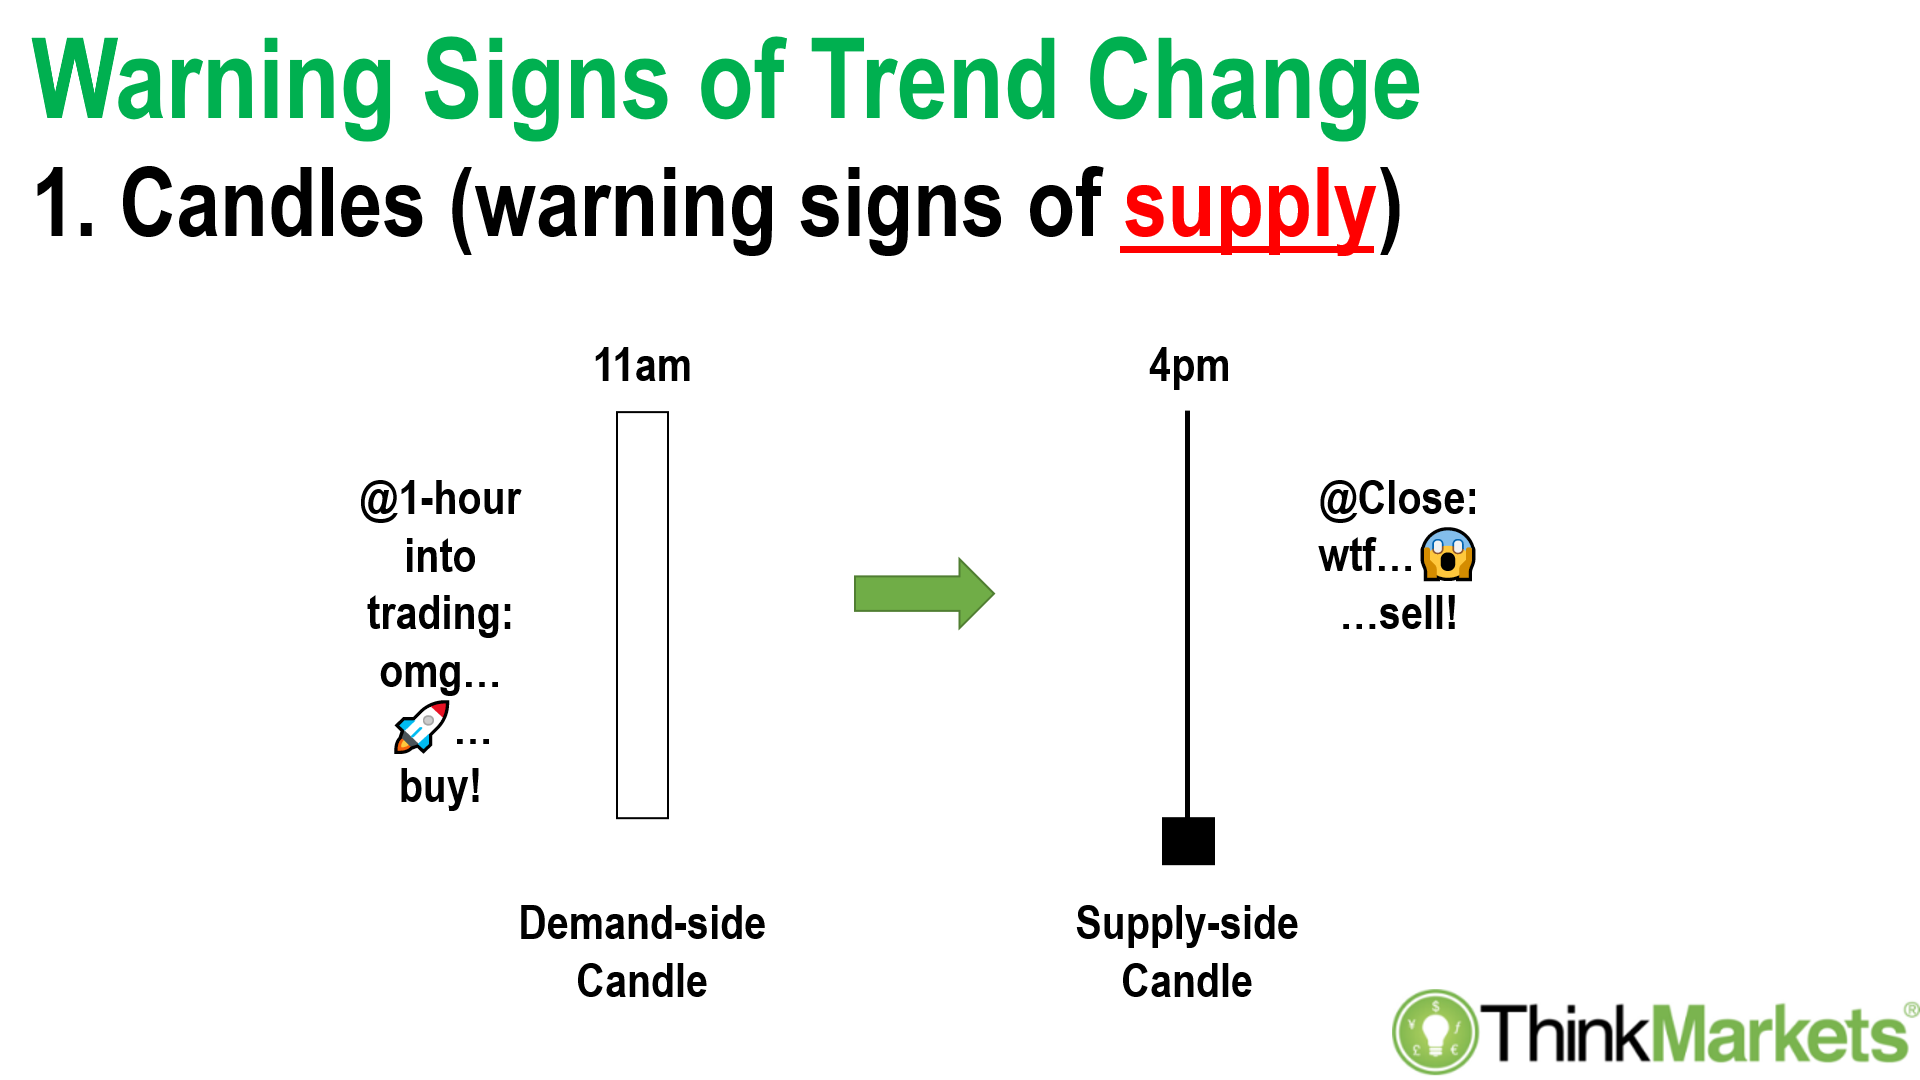
Consider the candle on the left in the above diagram. Pretend it's 11am Sydney time, that is, one hour our into normal trading on the ASX. The candle for the stock in question is a long, white-bodied candle which opened at the low of the session and is currently trading at high of the session. This specific candle pattern is called a Marubozu, which means "shaven head" in Japanese. You can see how the candle doesn’t have either an upward or downward pointing shadow, and therefore it appears to be shaven!
A white Marubozu is a strong indication the demand-side is in control of the price. It's really a picture of the demand-side's total domination in the market so far this session. However, fast forward 5 hours to the close at 4pm, and the demand-supply picture has changed dramatically. The long white body has transformed into a long shadow, and what body there is, is now black!
The only explanation for such a significant transformation is: excess supply has arrived. Either the demand-side backed off (what did they see which was so concerning, causing them to stop dishing out their cash?) or the supply-side increased their attack (what did they see which was so concerning to cause them to increasingly offload their holdings?). It could also be a combination of the two scenarios. Either way, the new candle, which we call a "shooting star", is a stark indicator the supply-side is taking control of the price.
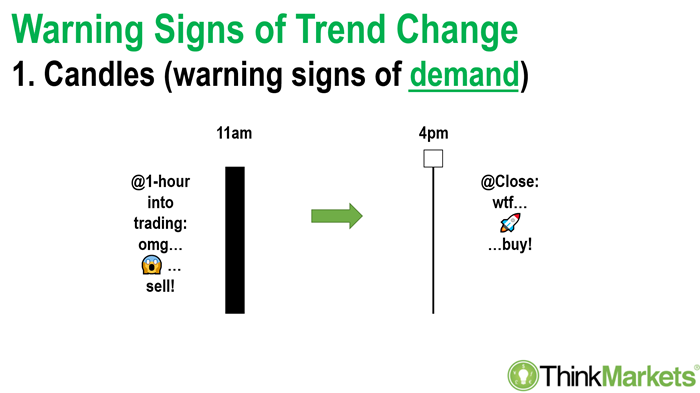
For completeness, let's consider the alternative where a stock's price has plunged around 1-hour into trading. That's the candle on the left in the above diagram. You can bet at this exact moment everyone watching the stock is thinking, "OMG it's the end of the world! I have to sell now!". Further, those who aren't in the smart money camp aren't even thinking of buying.
But the smart money knows better! They're licking their lips, thinking this is exactly the right price and the right time to buy – when everyone is selling. Afterall, think about it. If you're a market whale, and you want to buy a pile of stock without pushing up the price, the best time to do this is when plenty of other minnows are selling. Gulp! Bye, bye minnows!
At 4pm the whales have created an almighty downward-pointing shadow. This is the epitome of demand coming into the market, and similarly, of a supply-side reluctant to participate. The new candle, which we call a "hammer" because of its obvious resemblance to the ubiquitous tool, is a stark indicator the demand-side is taking control of the price.
In either case, that is hammers or shooting stars, the next candle is crucial in building the picture of trend change. When a hammer is observed, watch out for a confirming white candle the next day to indicate the demand side has indeed seized control and we're in a new short-term uptrend. A white Marubozu here would be particularly telling. Conversely, if a shooting star has been observed, be on the lookout for a confirming black candle the next day. Again, it might be a black Marubozu, thus sealing the deal for a new short-term downtrend.
Multi-Candle Trend Change Patterns
Following on from the above, trend change shouldn't be measured by a single candle. Let's now investigate a few patterns of trend change which consist of many candles. The key here is to locate a dominant demand candle or a dominant supply candle somewhere within the recent short-term trend.
Starting with the uptrend scenario, where the demand-side is in control of the price, we will likely observe numerous white candles or candles with lower shadows. A dominant demand candle is a candle which is significantly larger than its recent counterparts, that is, in terms of the length of its white body and/or the length of its downward-pointing shadow.
It is logical that the only way such a candle can form is due to the commitment of a substantial amount of demand in the market. It also makes sense that if the price were too close beneath the low point of the dominant demand candle, the demand which created it is no longer in the market. This should alert the technical analyst to the possibility of short-term trend change!
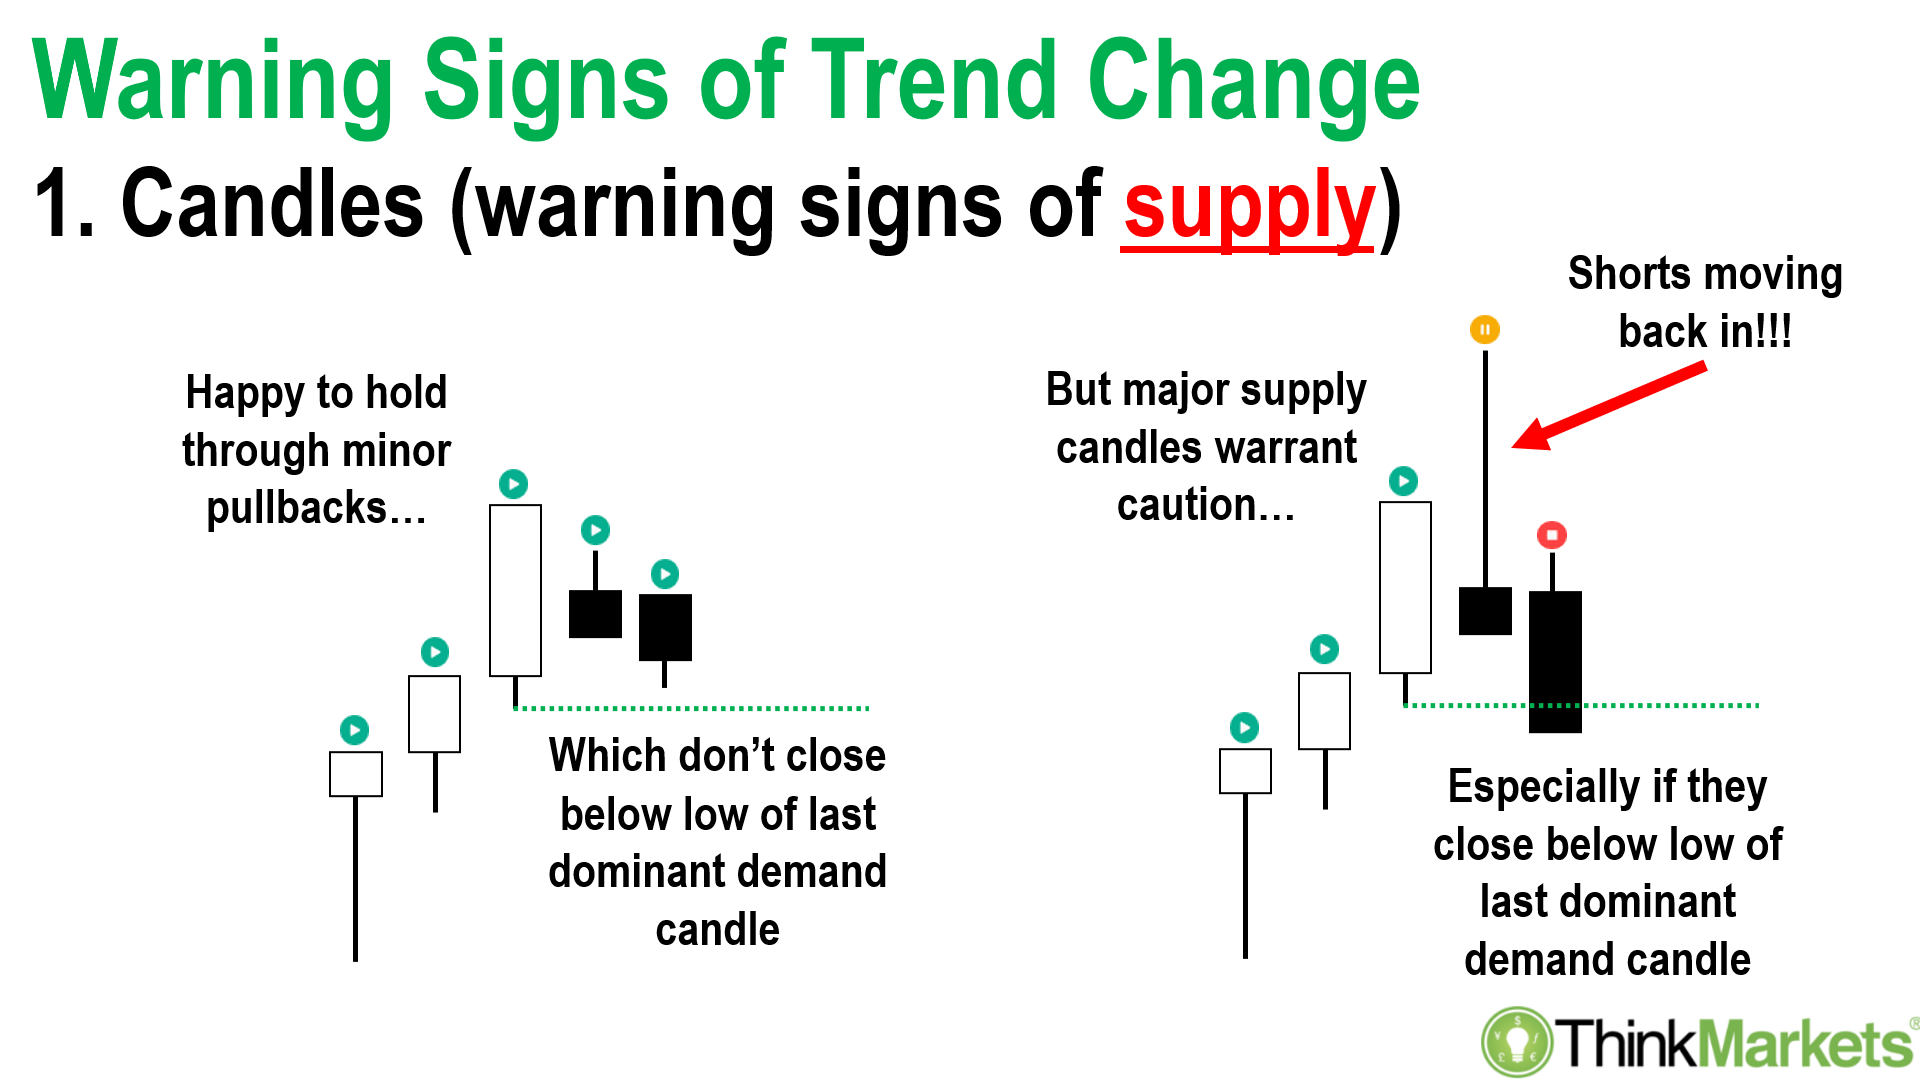
Consider the candle pattern on the left in the diagram above. The first and third candles qualify (in this sample!) as dominant candles. The third is the most recent, so we will use it as our marker in determining potential short-term trend change. No trend moves in a perfectly straight line. There will be candles which demonstrate a degree of doubt along the way. Candles 4 and 5 are excellent examples of this. Basically, one should be happy to hold as long as the low of the last dominant candle is not breached on a closing basis.
However, if you start to see the supply-side candles we talked about before, such as a shooting star or black Marubozu, then the risks of a bearish trend change are significantly elevated. Refer to the candle pattern on the right in the diagram above, something more sinister is afoot among the supply-side! A subsequent close beneath the low of the dominant candle seals the deal on a short-term trend change from up to down. Note, in this pattern I have deliberately drawn the shooting star and confirming black Marubozu together as they are often seen at the start of a new short-term downtrend.
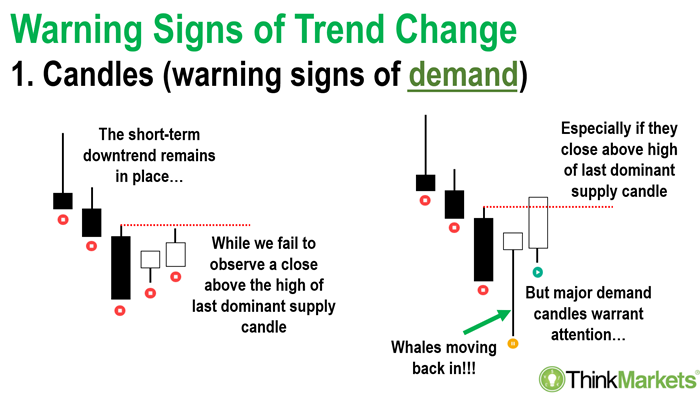
Turning the last case study on its head, we get to see what constitutes a change in short-term trend from down to up. Once again, we are using the dominant candle to draw a line in the sand for a turnaround. In this case, dominant supply-side candles. These are candles with long black bodies and/or long upward-pointing shadows. The theory is that the new short-term uptrend hasn't begun until a close above the high of the dominant candle.
In the candle pattern on the left in the diagram above, candles 4 and 5 do not trigger a short-term trend change from down to up. Yet, in the candle pattern on the right, the high of the dominant candle is breached on a closing basis, and the short-term downtrend is declared over in favour of the new short-term uptrend. Note also, the prevalence of the hammer on candle 4 in this example, and the confirming white Marubozu on candle 5. Again, these are deliberately drawn together as they frequently herald the start of a new short-term uptrend.
Learn More, Earn More!
I've only just scratched the surface of how to use Japanese candlestick patterns to identify trend change. There's so much more to cover. Articles are fantastic, but often the best way is to interact in real time. Fortunately, there is a way we can do this!
Each Tuesday I run a
free webinar which anyone can attend, where I teach Japanese candlestick analysis among many other technical analysis techniques. I do this whilst providing detailed technical and fundamental valuations for each company we investigate during the session. It's plenty of fun and the people who attend tell me they learn something new each time.
If you'd like to attend, follow this link to register!
We'll continue this discussion on the 3 Pillars of Trend Change in future editions on
price action, and dynamic support and resistance.
TM: Watch Carl discuss Japanese candlesticks and the case studies above on Ausbiz's the trade segment with Kyle Rodda:
Download my Bear Market Survival Guide eBook:
https://www.thinkmarkets.com/au/lp/2022-bear-market-survival-guide-ebook/
--------------------------------------
What's Inside?
--------------------------------------
This eBook will help you to navigate a bear market and learn strategies that traders use to find opportunities during bear cycles.
- Preparation - Bull vs Bear (and why it matters): Are we really in a bear market? And if so, how long will it last and how fall are markets likely to fall? What can we learn from the past?
- Opportunities: Learn how to identify resilient companies and diversification strategies, along with shorting and hedging techniques.
- Protection Strategies: Gain a better understanding of risk management, how to use charts to identify trends and how to diversify your portfolio during downtrends.
Any opinions, news, research, analyses, prices or other information contained on this website is provided as general market commentary and does not constitute investment advice. ThinkMarkets will not accept liability for any loss or damage including, without limitation, to any loss of profit which may arise directly or indirectly from use of or reliance on such information.