A topical look at technical analysis factors for ASX stocks of interest for 29 September.
In today's ThinkTechnical we'll take a look at the technical picture for a range of stocks from a range of different sectors.
We have property investor and manager Aventus Group (AVN); cinema operator Event Hospitality & Entertainment (EVT); technology companies Jaxsta (JXT) and Mach7 Technologies (M7T); financial services companies Money3 Corporation (MNY) and Moelis Australia (MOE); nickel producer and explorer Nickel Mines (NIC); and retailers Nick Scali (NCK) and Shaver Shop Group (SSG).
Aventus Group (AVN)
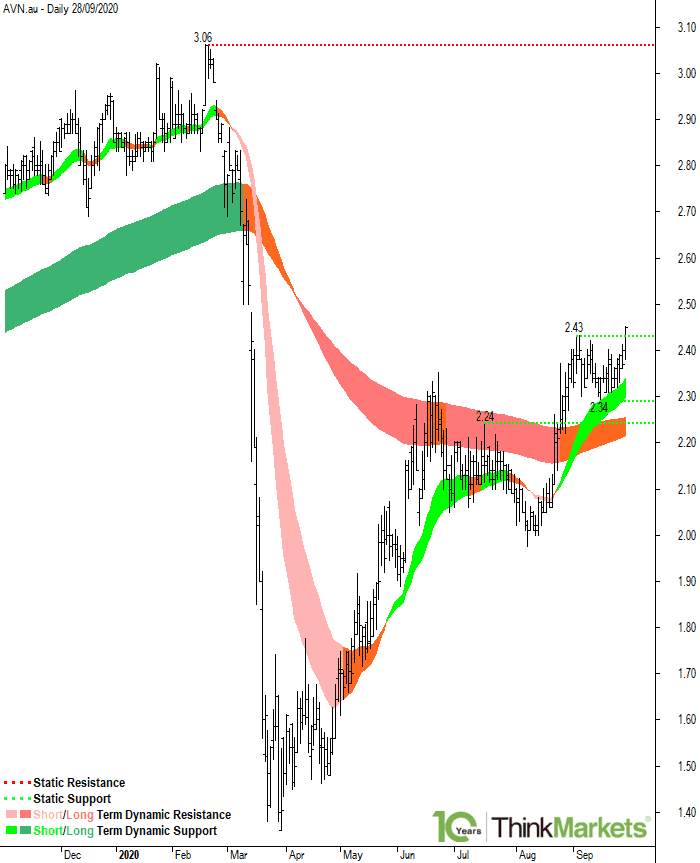
Aventus Group is in a well-defined short term uptrend, as evidenced by the 21 EMA located above the 34 EMA and with each EMA rising. The long term trend is undefined, as evidenced the 144 EMA located below the 233 EMA but with each EMA rising. It is likely that these EMAs cross in the near future, therefore initiating a new long term uptrend.
Static resistance will be encountered at the 03 Sep 2020 high of 2.43, and then at the 19 Feb 2020 high of 3.06.
Static support will be encountered at the 15 Sep 2020 low of 2.34, and then at the 16 Jul 2020 high of 2.24.
Note that static support at 2.34 coincides with dynamic short term support expected to be encountered in the zone defined by the 21-34 EMAs, projected between 2.30 and 2.35. Whenever multiple support factors coincide, the market response at the zone defined by these factors tends to be stronger. The price has been consistently rebounding higher out of the short term dynamic support zone since the short term uptrend began in August. This highlights the importance of this zone as a future area of potential dynamic short term support going forwards.
The dynamic long term resistance zone is defined by the 21-34 EMAs, projected between 2.22 and 2.26. The price has been consistently rebounding lower out of the long term dynamic resistance zone since the long term downtrend began in April. The key issue now, is that the price is currently trading above this zone. If this situation continues, the zone may well switch from offering dynamic long term resistance to offering dynamic long term support.
Targets are to the 19 Feb 2020 high of 3.06. Beyond 3.06, AVN is at all-time highs, and therefore targets are open ended. Note however, static resistance will likely be ecountered at the 4.00 round number.
Traders may wish to buy at the static and dynamic support zones with stops set below these levels. If this cannot be achieved, then traders may have to consider buying on a breach of Monday's high of 2.45.
Event Hospitality & Entertainment (EVT)
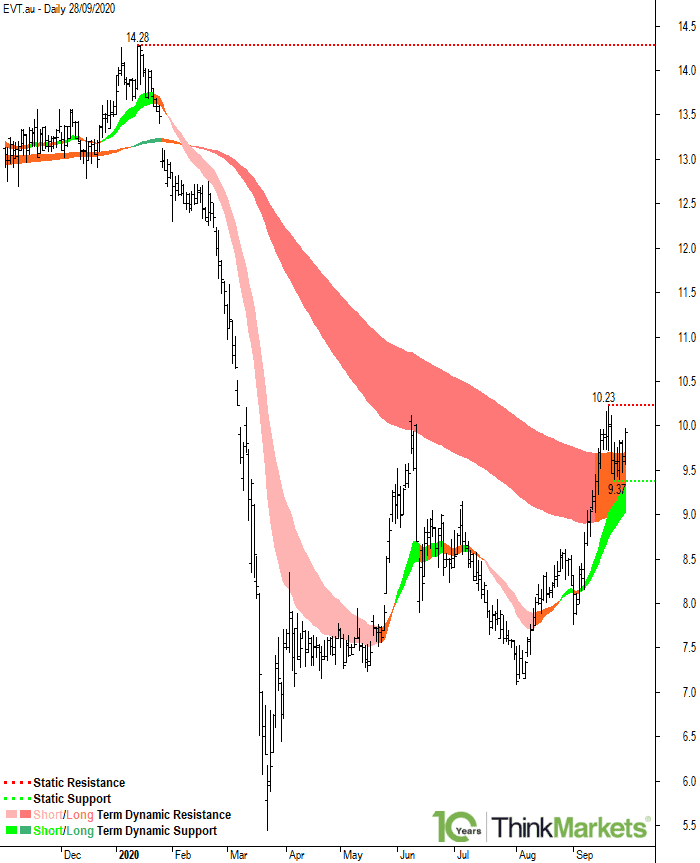
Event Hospitality & Entertainment is in a well-defined short term uptrend, as evidenced by the 21 EMA located above the 34 EMA and with each EMA rising. The long term trend is undefined, as evidenced the 144 EMA located below the 233 EMA but with each EMA rising. It is likely that these EMAs cross in the near future, therefore initiating a new long term uptrend.
Static resistance will be encountered at the 18 Sep 2020 high of 10.23, and then at the 14 Jan 2020 high of 14.28.
Static support will be encountered at the 22 Sep 2020 low of 9.37.
The dynamic short term support zone is defined by the 21-34 EMAs, projected between 9.05 and 9.32. The price has been consistently rebounding higher out of the short term dynamic support zone since the short term uptrend began in August. This highlights the importance of this zone as a future area of potential dynamic short term support going forwards.
The dynamic long term resistance zone is defined by the 21-34 EMAs, projected between 9.05 and 9.65. The price has been consistently rebounding lower out of the long term dynamic resistance zone since the long term downtrend began in February. The key issue now, is that the price is currently trading above this zone. If this situation continues, the zone may well switch from offering dynamic long term resistance to offering dynamic long term support.
Targets are to the 14 Jan 2020 high of 14.28. Beyond 14.28, EVT has little in the way of key price action-based static resistance points to impede upside progress. Note however, static resistance will likely be ecountered at the 15.00 round number.
Traders may wish to buy at the static and dynamic support zones with stops set below these levels. If this cannot be achieved, then traders may have to consider buying on a breach of Monday's high of 9.96.
Jaxsta (JXT)
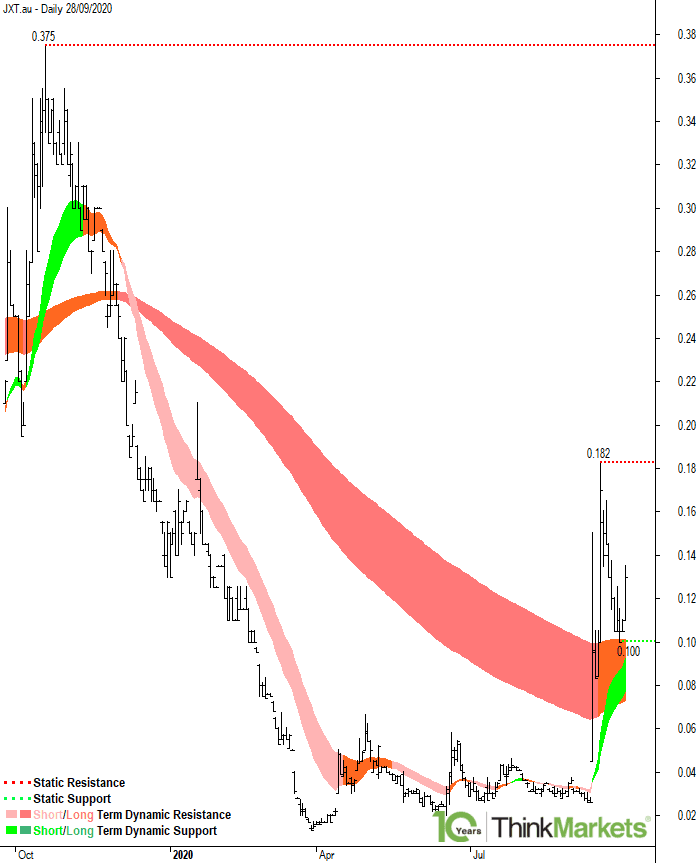
Jaxsta is in a well-defined short term uptrend, as evidenced by the 21 EMA located above the 34 EMA and with each EMA rising. The long term trend is undefined, as evidenced the 144 EMA located below the 233 EMA but with each EMA rising. It is likely that these EMAs cross in the near future, therefore initiating a new long term uptrend.
Static resistance will be encountered at the 15 Sep 2020 high of 0.182, and then at the 16 Oct 2019 high of 0.375.
Static support will be encountered at the 24 Sep 2020 low of 0.100.
The dynamic short term support zone is defined by the 21-34 EMAs, projected between 0.078 and 0.093.
The dynamic long term resistance zone is defined by the 21-34 EMAs, projected between 0.075 and 0.100. The key issue now, is that the price is currently trading above this zone. If this situation continues, the zone may well switch from offering dynamic long term resistance to offering dynamic long term support.
Targets are to the 15 Sep 2020 high of 0.182. The next key target is 0.375.
Traders may wish to buy at the static and dynamic support zones with stops set below these levels. If this cannot be achieved, then traders may have to consider buying on a breach of Monday's high of 0.135.
Mach7 Technologies (M7T)
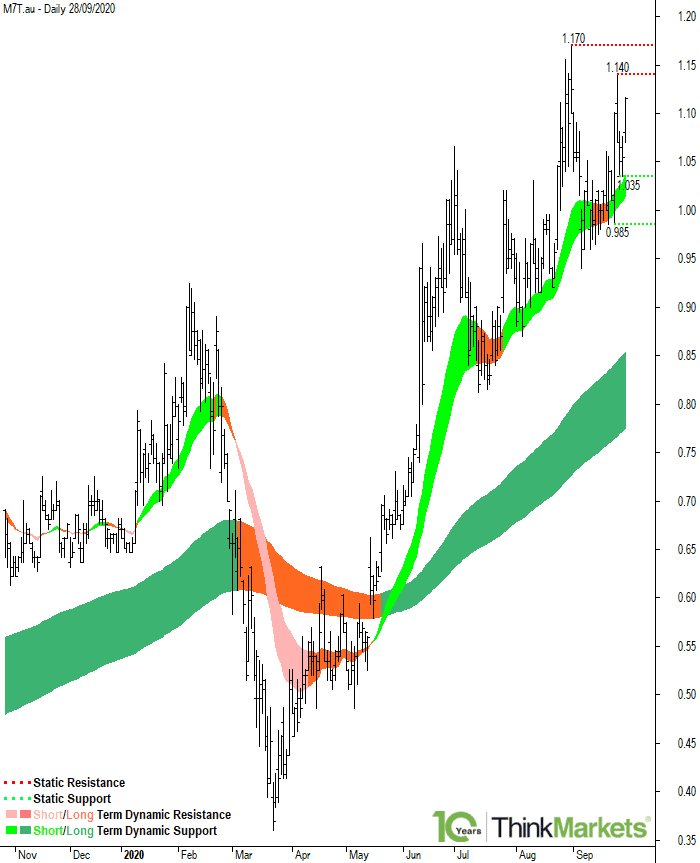
Mach7 Technologies is in a well-defined short term uptrend, as evidenced by the 21 EMA located above the 34 EMA and with each EMA rising. The long term uptrend is also well-defined, as evidenced by the 144 EMA located above the 233 EMA and with each EMA rising.
Static resistance will be encountered at the 23 Sep 2020 high of 1.140, and then at the 31 Aug 2020 high of 1.170.
Static support will be encountered at the 24 Sep 2020 low of 1.035, and then at the 18 Sep 2020 low of 0.985.
Note that static support at 1.035 coincides with dynamic short term support expected to be encountered in the zone defined by the 21-34 EMAs, projected between 1.015 and 1.040. Whenever multiple support factors coincide, the market response at the zone defined by these factors tends to be stronger. The price has been consistently rebounding higher out of the short term dynamic support zone since the short term uptrend began in May. This highlights the importance of this zone as a future area of potential dynamic short term support going forwards.
Beyond 1.170, M7T is at all-time highs, and therefore targets are open ended. Note however, static resistance will likely be encountered at the 2.000 round number.
Traders may wish to buy at the static and dynamic support zones with stops set below these levels. If this cannot be achieved, then traders may have to consider buying on a breach of Monday's high of 1.115.
Money3 Corporation (MNY)
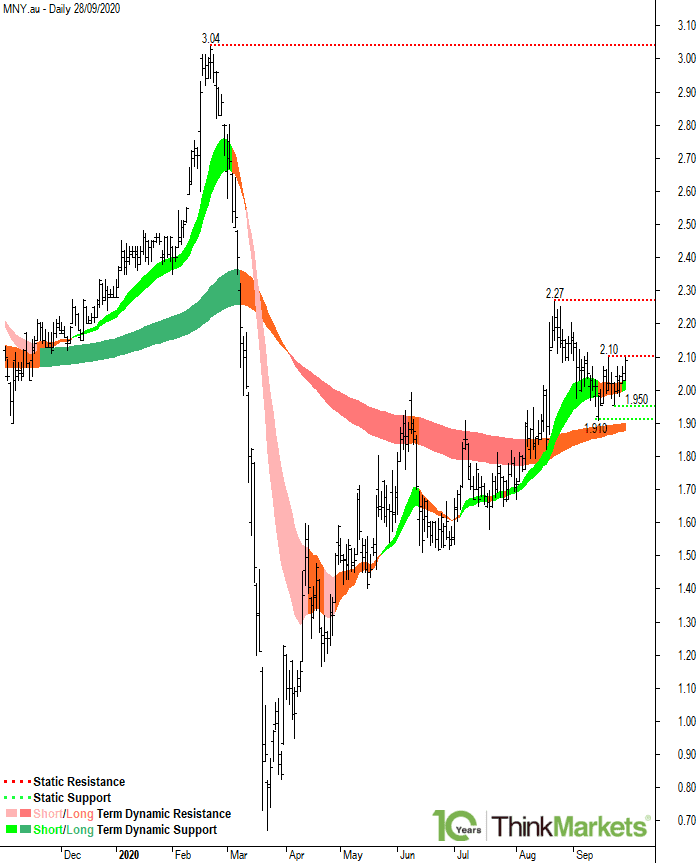
Money3 Corporation is in a well-defined short term uptrend, as evidenced by the 21 EMA located above the 34 EMA and with each EMA rising. The long term trend is undefined, as evidenced the 144 EMA located below the 233 EMA but with each EMA rising. It is likely that these EMAs cross in the near future, therefore initiating a new long term uptrend.
Static resistance will be encountered at the 18 Sep 2020 high of 2.10, the 21 Aug 2020 high of 2.27, and then at the 21 Feb 2020 high of 3.04.
Static support will be encountered at the 22 Sep 2020 low of 1.95, and then at the 14 Sep 2020 low of 1.91.
The dynamic short term support zone is defined by the 21-34 EMAs, projected between 2.00 and 2.03. The price has been consistently rebounding higher out of the short term dynamic support zone since the short term uptrend began in July. This highlights the importance of this zone as a future area of potential dynamic short term support going forwards.
The dynamic long term resistance zone is defined by the 21-34 EMAs, projected between 1.88 and 1.91. The price has been consistently rebounding lower out of the long term dynamic resistance zone since the long term downtrend began in April. The key issue now, is that the price is currently trading above this zone. If this situation continues, the zone may well switch from offering dynamic long term resistance to offering dynamic long term support.
Targets are to the 21 Feb 2020 high of 3.04. Beyond 3.04, MNY is at all-time highs, and therefore targets are open ended. Note however, static resistance will likely be ecountered at the 4.00 round number.
Traders may wish to buy at the static and dynamic support zones with stops set below these levels. If this cannot be achieved, then traders may have to consider buying on a breach of 2.10.
Moelis Australia (MOE)
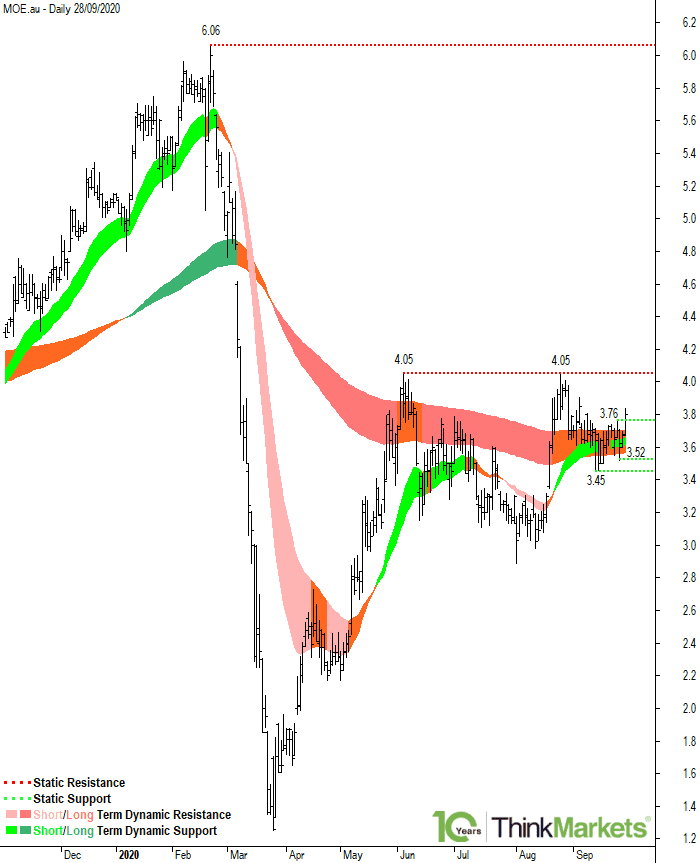
Moelis Australia is in a well-defined short term uptrend, as evidenced by the 21 EMA located above the 34 EMA and with each EMA rising. The long term trend is undefined, as evidenced the 144 EMA located below the 233 EMA but with each EMA rising. It is likely that these EMAs cross in the near future, therefore initiating a new long term uptrend.
Static resistance will be encountered at the 25 Aug 2020 high of 4.05, which coincides with the 03 Jun 2020 high of 4.05, and then at the 21 Feb 2020 high of 6.06.
Static support will be encountered at the 24 Sep 2020 low of 3.52, and then at the 14 Sep 2020 low of 3.45.
The dynamic short term support zone is defined by the 21-34 EMAs, projected between 3.62 and 3.67. The price has been consistently rebounding higher out of the short term dynamic support zone since the short term uptrend began in August. This highlights the importance of this zone as a future area of potential dynamic short term support going forwards.
The dynamic long term resistance zone is defined by the 21-34 EMAs, projected between 3.57 and 3.71. The price has been consistently rebounding lower out of the long term dynamic resistance zone since the long term downtrend began in March. The key issue now, is that the price is currently trading above this zone. If this situation continues, the zone may well switch from offering dynamic long term resistance to offering dynamic long term support.
Targets are to the 21 Feb 2020 high of 6.06. Beyond 6.06, MOE has little in the way of key price action-based static resistance points to impede upside progress. Note however, static resistance will likely be ecountered at the 8.00 round number.
Traders may wish to buy at the static and dynamic support zones with stops set below these levels. If this cannot be achieved, then traders may have to consider buying on a breach of Monday's high of 3.83.
Nick Scali (NCK)
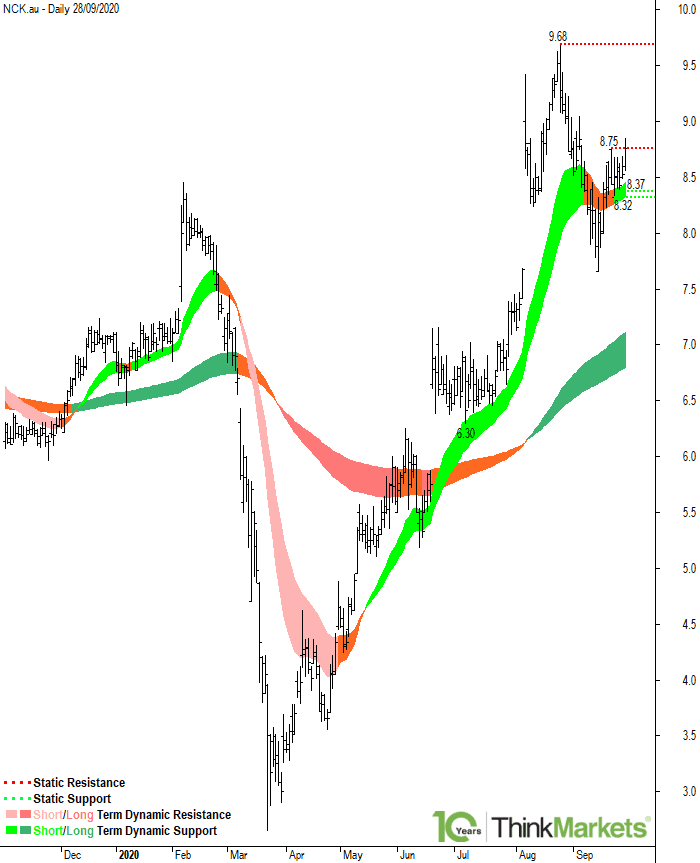
Nick Scali is in a well-defined short term uptrend, as evidenced by the 21 EMA located above the 34 EMA and with each EMA rising. The long term uptrend is also well-defined, as evidenced by the 144 EMA located above the 233 EMA and with each EMA rising.
Static resistance will be encountered at the 21 Sep 2020 high of 8.75, and then at the 25 Aug 2020 high of 9.68.
Static support will be encountered at the 24 Sep 2020 low of 8.37, and then at the 22 Sep 2020 low of 8.32.
Note that static support at 8.37 coincides with dynamic short term support expected to be encountered in the zone defined by the 21-34 EMAs, projected between 8.34 and 8.47. The price has been consistently rebounding higher out of the short term dynamic support zone since the short term uptrend began in May. This highlights the importance of this zone as a future area of potential dynamic short term support going forwards.
Beyond 9.68, NCK is at all-time highs, and therefore targets are open ended. Note however, static resistance will likely be ecountered at the 10.00 round number.
Traders may wish to buy at the static and dynamic support zones with stops set below these levels. If this cannot be achieved, then traders may have to consider buying on a breach of Monday's high of 8.84.
Nickel Mines (NIC)
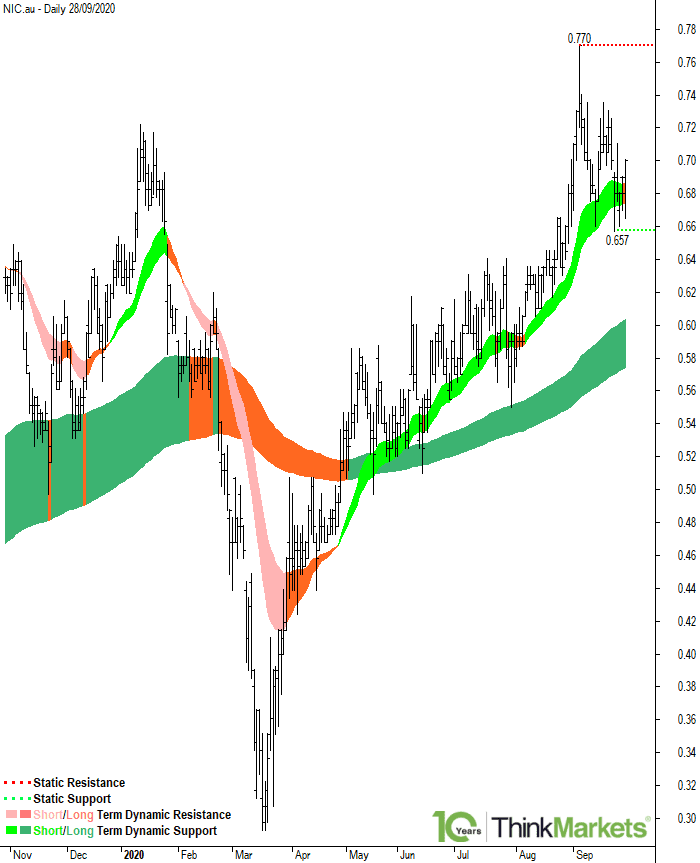
Nickel Mines is in a short term uptrend, as evidenced by the 21 EMA located above the 34 EMA. The long term uptrend is well-defined, as evidenced by the 144 EMA located above the 233 EMA and with each EMA rising.
Static resistance will be encountered at the 03 Sep 2020 high of 0.770.
Static support will be encountered at the 22 Sep 2020 low of 0.657.
The dynamic short term support zone is defined by the 21-34 EMAs, projected between 0.675 and 0.690. The price has been consistently rebounding higher out of the short term dynamic support zone since the short term uptrend began in April. This highlights the importance of this zone as a future area of potential dynamic short term support going forwards.
Beyond 0.770, NIC is at all-time highs, and therefore targets are open ended. Note however, static resistance will likely be encountered at the 1.000 round number.
Traders may wish to buy at the static and dynamic support zones with stops set below these levels. If this cannot be achieved, then traders may have to consider buying on a breach of Monday's high of 0.700.
Shaver Shop Group (SSG)
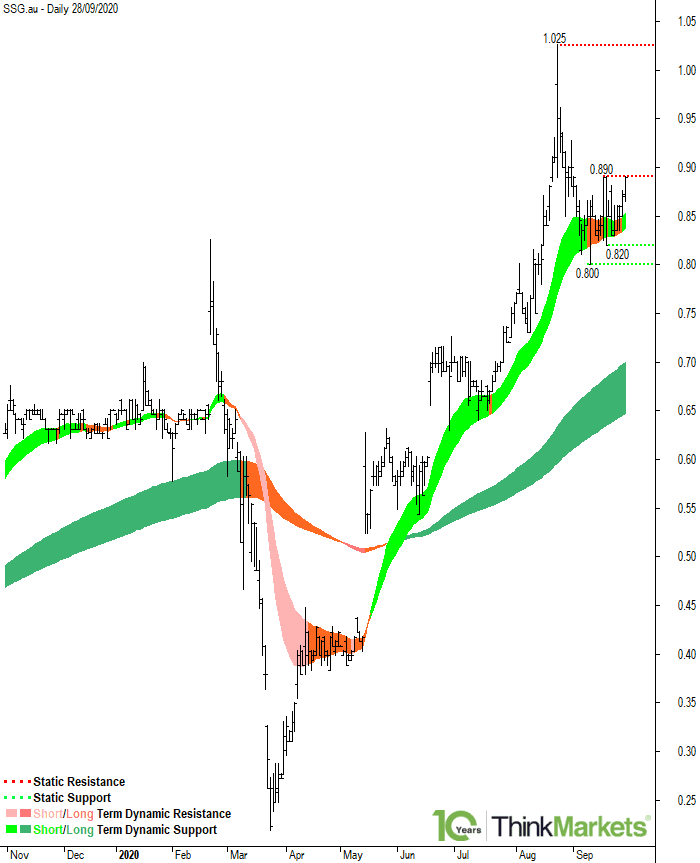
Shaver Shop Group is in a well-defined short term uptrend, as evidenced by the 21 EMA located above the 34 EMA and with each EMA rising. The long term uptrend is also well-defined, as evidenced by the 144 EMA located above the 233 EMA and with each EMA rising.
Static resistance will be encountered at the 16 Sep 2020 high of 0.890, and then at the 24 Aug 2020 high of 1.025.
Static support will be encountered at the 17 Sep 2020 low of 0.820, and then at the 09 Sep 2020 low of 0.800.
The dynamic short term support zone is defined by the 21-34 EMAs, projected between 0.840 and 0.855. The price has been consistently rebounding higher out of the short term dynamic support zone since the short term uptrend began in May. This highlights the importance of this zone as a future area of potential dynamic short term support going forwards.
Beyond 1.025, SSG has little in the way of key price action-based static resistance points to impede upside progress. Note however, static resistance will likely be encountered at the 2.000 round number.
Traders may wish to buy at the static and dynamic support zones with stops set below these levels. If this cannot be achieved, then traders may have to consider buying on a breach of Monday's high of 0.890.