CFDs are complex instruments and come with a high risk of losing money rapidly due to leverage. 70% of retail investor accounts lose money when trading CFDs with this provider.
You should consider whether you understand how CFDs work and whether you can afford to take the high risk of losing your money.

Learn To Trade
 
Indicators & Chart Patterns

Deepen your knowledge of technical analysis indicators and hone your skills as a trader.

Find your detailed guides here
Trading Glossary

From beginners to experts, all traders need to know a wide range of technical terms. Let us be your guide.

Learn more
Knowledge Base

No matter your experience level, download our free trading guides and develop your skills.

Learn more
Learn To Trade

Trade smarter: boost your skills with our training resources.

Create a live account
Market Analysis
 
Market News

All the latest market news, with regular insights and analysis from our in-house experts

Learn more
Economic Calendar

Make sure you are ahead of every market move with our constantly updated economic calendar.

Learn more
Technical Analysis

Harness past market data to forecast price direction and anticipate market moves.

Learn more
Live Webinars

Boost your knowledge with our live, interactive webinars delivered by industry experts.

Register now
Special Reports

Engaging, in-depth macroeconomic analysis and expert educational content from our in-house analysts

Learn more
Market Analysis

Harness the market intelligence you need to build your trading strategies.

Create a live account
Partnership
 
Affiliate Programme

Grow your business and get rewarded. Find out more about our Affiliate Programme today.

Learn more
Introducing Broker

ThinkMarkets ensures high levels of client satisfaction with high client retention and conversion rates.

Learn more
White Label

We supply everything you need to create your own brand in the Forex industry.

Learn more
Regional Representatives

Partner with ThinkMarkets today to access full consulting services, promotional materials and your own budgets.

Learn more
Partnership

Plug into the next-gen platforms and the trades your clients want.

Partner Portal
About ThinkMarkets
 
Sponsorships

Check out our sponsorships with global institutions and athletes, built on shared values of excellence.

Learn more
About Us

Find out more about ThinkMarkets, an established, multi-award winning global broker you can trust.

Learn more
Careers

Discover a range of rewarding career possibilities across the globe

Apply now
Security of Funds

Security of your funds is our number one priority. We safeguard our Client funds in top tier banks.

Learn more
ThinkMarkets News

Keep up to date with our latest company news and announcements

Learn more
Trading Infrastructure

When it comes to the speed we execute your trades, no expense is spared. Find out more.

Learn more
Contact Us

Our multilingual support team is here for you 24/7.

Learn more
About ThinkMarkets

Global presence, local expertise - find out what sets us apart.

Create a live account
Log in Create account

Crude battles back: Potential 8% surge on the horizon amidst OPEC+ negotiations

Alejandro Zambrano Alejandro Zambrano 29/11/2023
Crude battles back: Potential 8% surge on the horizon amidst OPEC+ negotiations Crude battles back: Potential 8% surge on the horizon amidst OPEC+ negotiations
Crude battles back: Potential 8% surge on the horizon amidst OPEC+ negotiations Alejandro Zambrano

While many markets are in a Thanksgiving lull this week, Brent crude oil (BRENT) prices are capturing traders' attention for valid reasons. 
 

The OPEC+ meeting, initially scheduled earlier this week, has been postponed to Thursday at 13:00 GMT. A Reuter’s source suggests that resolving a quota dispute among oil producers is crucial before the meeting. It is also anticipated that the meeting will result in significant supply cuts. This comes as Brent crude oil prices have declined from $98 to $76 in recent months, stabilising around $80. The supply cuts continue the reduction strategy started in 2022, where OPEC+ aims to cut 5% of the total crude oil supply. 
 

However, oil producers are feeling the strain with crude oil prices reverting to December 2022 levels, marking a 38% decrease from 2022's peak. 
 

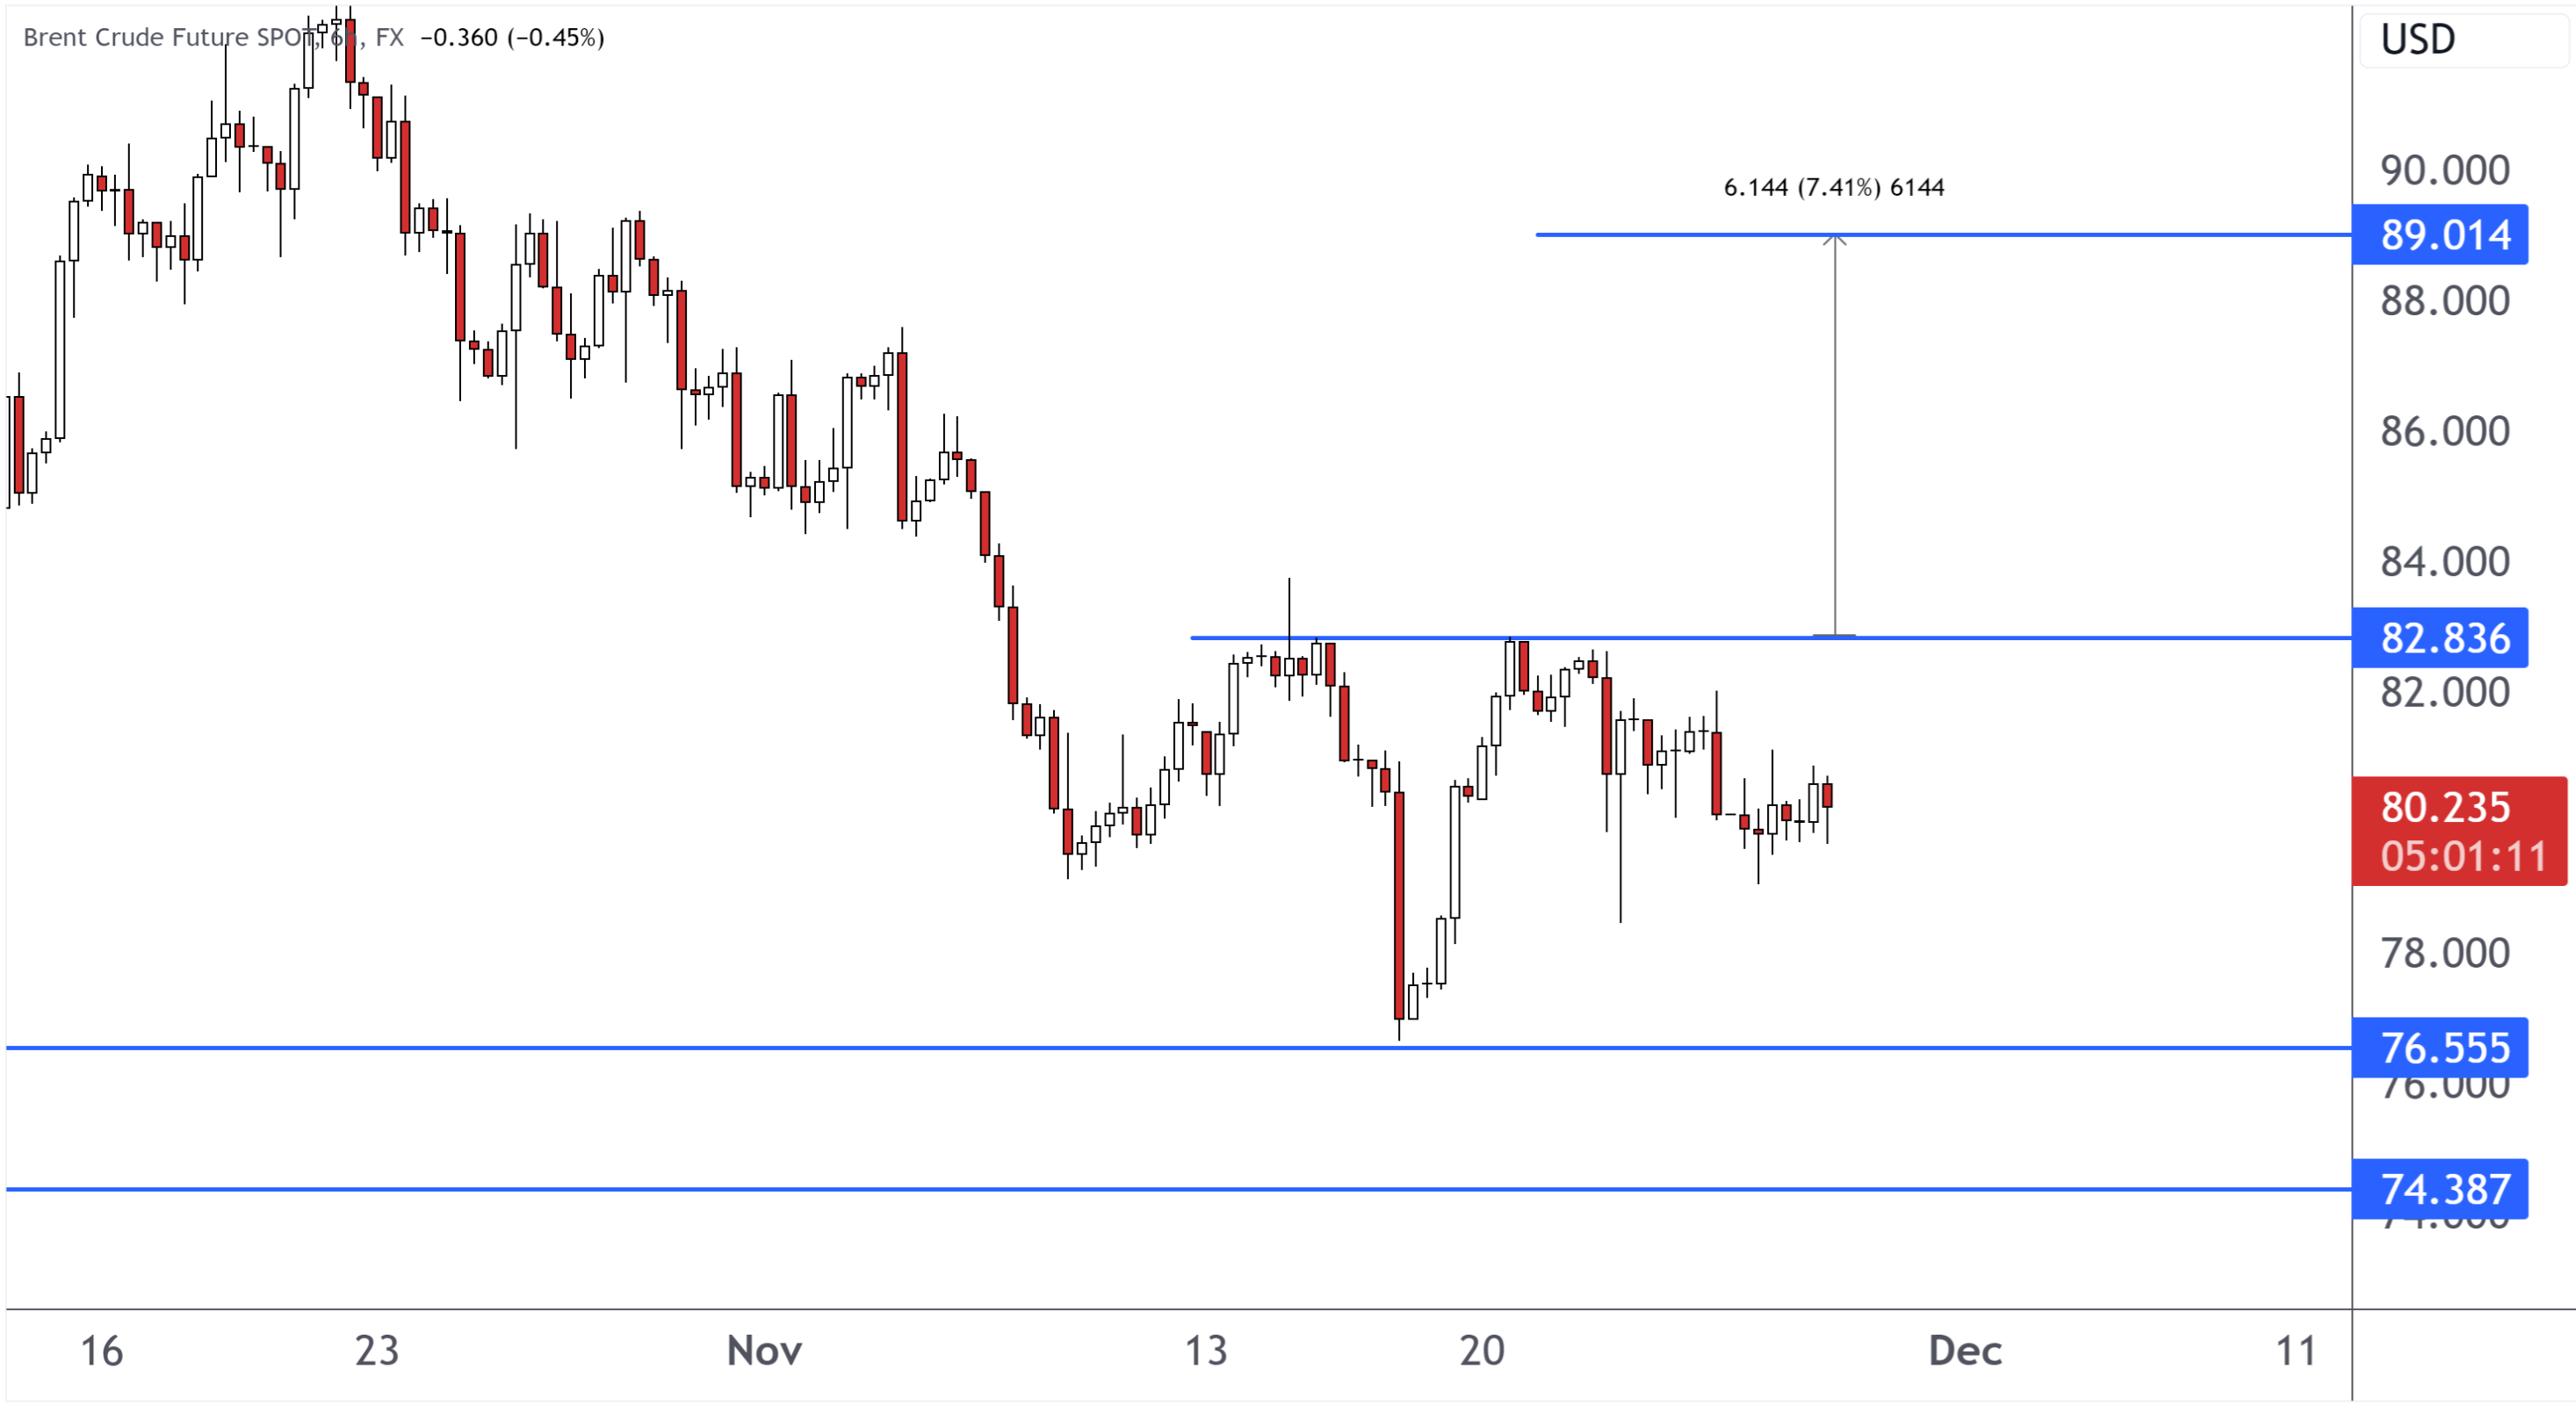
Observing these producers' challenges, traders have quietly carved out an inverse head and shoulders pattern over the past 20 days. While modest and nascent, this pattern indicates that breaching the neckline could raise prices by as much as 8%, potentially reaching $89 per barrel. According to this pattern, a breakthrough at the $82.83 neckline, combined with the anticipated supply cuts, could be the catalyst needed to drive the market upwards. 
 

Brent Crude oil CFD, Daily Chart 


What is an inverse head and shoulders pattern? 


The inverse head and shoulders pattern typically forms during a downtrend. It begins when the price drops to a new lower low, for example, from $100 to $90. A rebound follows this, but the rebound often does not reach the original level before the decline, settling at a lower high, e.g., $95. 
 

As the price reaches $95, sellers again drive the price down, this time to an even lower low, perhaps to $85, creating the 'head' of the pattern. However, they don’t have enough strength to maintain the price at these lows, leading to a sharp rise, approaching the level of the first rebound, back to around $95. 
 

The sellers make another attempt to drive the price down, reaching the level of the first low ($90), but they fail to push the price below this level. This inability to reach a new lower low indicates a weakening downtrend and forms the second shoulder of the pattern.   
 

We now have two highs at $95, so we can draw a trendline via them and call it the neckline. Once the price breaks above this neckline, the inverse head and shoulders pattern is considered complete.  
 

The objective of the pattern is calculated by measuring the distance from the lowest point of the head ($85) to the neckline ($95) and projecting this distance upwards from the neckline. In this example, the difference is $10, so the price target would be $105 ($95 + $10). The pattern suggests that as long as the price does not fall below the neckline, the bullish reversal will likely continue towards its target. 
 

Go long or short on BRENT with an award-winning broker today. Make the most of ThinkTrader’s extensive set of technical analysis tools to build your own strategy. 
 

Open an account now: portal.thinkmarkets.com 

Any opinions, news, research, analyses, prices or other information contained on this website is provided as general market commentary and does not constitute investment advice. ThinkMarkets will not accept liability for any loss or damage including, without limitation, to any loss of profit which may arise directly or indirectly from use of or reliance on such information.
Back to top