 Download Carl's Bear Market Survival Guide e-Book:
https://www.thinkmarkets.com/au/lp/2023-bear-market-survival-guide-ebook/
Download Carl's Bear Market Survival Guide e-Book:
https://www.thinkmarkets.com/au/lp/2023-bear-market-survival-guide-ebook/
Many traders are probably glad to see the back of August! It was a month punctuated by extreme volatility as long-term interest rates spiked, tanking many risk-on assets. Remember, rising bond yields occur because of falling bond prices, so it was one of those rare months where stock and bond prices fell at the same time.
Stocks and bonds are traditionally seen as complimentary investments, where stocks represent risk seeking (i.e., "
risk-on") and bonds represent risk aversion (i.e., "
risk-off"). Usually, one asset class tends to prosper at the expense of the other as investors rebalance their risk based upon changing macroeconomic conditions.
Let me emphasise the word "usually" here, because since Chairman Powell's reappointment back in November 2022 and subsequent lift off in interest rates, there's been significant bouts of positive correlation between stocks and bonds. And this is typical of a rapidly rising interest rate environment. Rapidly rising interest rates hurt both stocks and bonds simultaneously.
The upshot of the above for many investors, is there's few places to hide but cash. It also naturally increases volatility and uncertainty, and therefore in months like August, it can get a bit hot in the investing kitchen. I'm a trend follower, not a volatility trader, so when markets get choppy, I prefer to avoid getting chopped up and get out of the proverbial kitchen!
Given it's the end of August, the only thing I can say for certain right now is we're about to hit the first week of September – and that means US Non-Farm Payrolls data! Released each first Friday of the month like clockwork, NFPs as they're commonly referred to, are considered the most important monthly datapoint for forex trades.
In addition to NFPs, this week will likely see August go out with a bang as we get preliminary second quarter US GDP data on Tuesday, and Core Personal Consumption Expenditures (PCE) Price Index data on Thursday. Let's preview each data point and plan some potential forex trades for the various contingencies.
US Preliminary Q2 GDP Wednesday 12:30pm GMT
GDP stands for Gross Domestic Product. That's fancy economist talk for a nation's economic output. The greater a country's output, the healthier the country's economy, and probably, the stronger it’s jobs market and government finances. A strong economy is typically associated with higher interest rates within that economy, and higher interest rates is typically associated with a stronger currency.
There are a few readings of GDP which is generally measured on a quarterly basis. The first-most reading is the
Advance which comes out in the month after quarter's end. It's usually a partial overview of the quarter and is more of an estimate. Then there's the
Preliminary reading which usually comes out a month later than the Advance. It generally now has complete data, and accounts for revisions prior reading. Finally, well, there's
Final GDP. Funny that! It's complete and you guessed it, final! It comes out up to three months after the end of the relevant quarter, and therefore the market usually takes less notice of it – because it's ancient history by the time it's released. Advance and Preliminary GDP releases are usually the most valuable data for economists.
Wednesday's release is likely to show the US economy continued to grow robustly in the second quarter. Economists’ consensus forecast is US economy growth should be revised higher by 0.1% to 2.5% p.a. If the Advance estimate is anything to go by, expect most of the strength to come from rising inventories and investment – both very strong forward indications (i.e., as they imply businesses are gearing up for a strong second half).
US Core PCE Price Index Thursday 12:30pm GMT
This is kinda the big one this week. At the start of this article, we discussed the rocket under rates since November 2022. That rocket is there because of this data point, or more specifically, the inflation it measures.
Da-da-daam, the "
I" word!
The core PCE Price Index measures the change in the price of goods and services purchased by households and businesses within the US economy. It differs from the Consumer Price Index (CPI) which measures the change in the price of an explicit basket of goods and services. Therefore, the PCE Price Index is much broader than the CPI, and it is widely considered to be the Federal Reserve's preferred measure of inflation.
Incomes and consumption so far have held up well in the face of those rising rates, and this has stoked inflation in the US economy. This week's August Core PCE Price Index is expected to show US inflation edged higher in July to 4.2% p.a., up from June's 4.1% (which was down from March-May's 4.6% p.a.). "
Sticky-high" is one way to describe it. The Fed wants this back at its 2% target, and it won't relinquish its grip on the current high interest rates until it sees meaningful progress in this regard.
The upshot for forex traders with respect to the Core PCE Price Index is this: hotter (i.e., higher) implies higher US interest rates which in turn implies a stronger Greenback against its counterparts. Vice-versa for a cooler (i.e., weaker) Core PCE Price Index.
US Non-Farm Employment Change and Unemployment Rate, Friday 12:30pm GMT
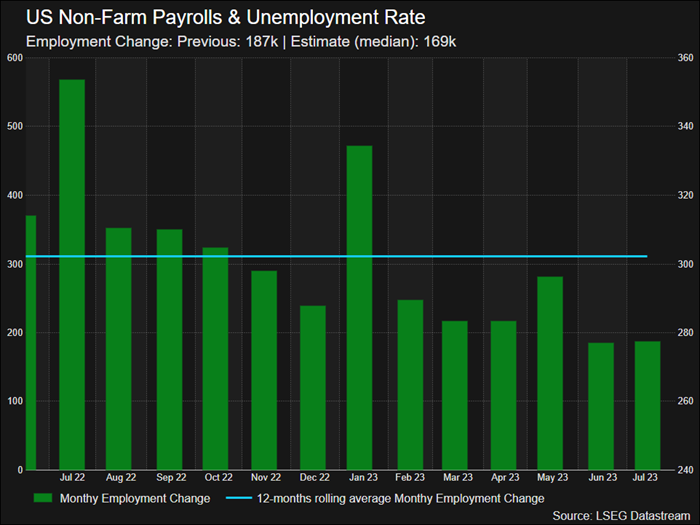
The cherry on the icing on the economic data cake is going to be US employment data on Friday. Monthly US jobs growth has slowed in 9 out of the last 12-months and is roughly back to its long-term average prior to the pandemic. Last month, the data showed 187,000 jobs were created in the US economy in the month of July, down from June's 209,000. This month economists expect just 169,000 jobs were created. If this is the case, August's jobs growth number will be substantially lower than the 12-month rolling average of 302,000 jobs created per month.
 Click to enlarge image
Despite the slowdown in US jobs growth, the unemployment rate is expected to remain steady at 3.5%. Average hourly earnings growth is expected grow by 0.2% on a monthly basis, but to remain steady on an annualised basis at 4.4% p.a. This degree of wages growth is uncomfortably high for the Fed, which ideally would love to see this rate closer to 3% p.a.
The upshot for forex traders with respect to NFP data is this: hotter implies a strong jobs market, and therefore likely strong consumer spending, which itself will likely feed into higher inflation. Join one more dot and you get higher interest rates, and one more dot again gets you to a stronger Greenback. A cooler number would trigger the opposite, that is, a weaker US dollar.
How to trade this week's US economic data
When trading economic data, I prefer to identify two currency pairs which are likely to be impacted by the data. One pair should show a strong price trend correlating to strength of one of the currencies in the pair, and the other pair should show a strong price trend correlating to weakness of that same currency. This means we'll have a trend-based trade if the data is better expected, as well as a trend-based trade if the data is worse than expected.
Given we're assessing US data, naturally we're going to look for trades against the USD. So, let's consider: Which US currency pair is showing the greatest USD strength? This is the pair I will look to go long the USD in the event of a stronger than expected data points. Conversely: Which currency pair is showing the greatest USD weakness? This is the pair I will look to short the USD in the event of a weaker than expected data points.
Looking across the options, I have come up with my two favourite potential trades on this week's US economic data.
Stronger than expected Preliminary GDP, Core PCE Price Index, or NFPs: LONG USDJPY
 Click to enlarge image
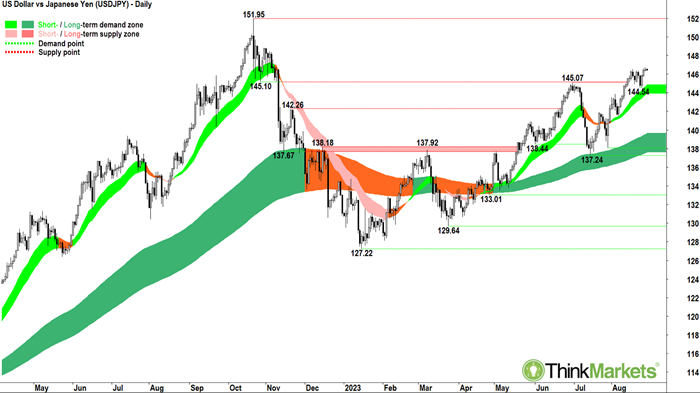
The USDJPY chart shows the price is in a short-term uptrend (light green ribbon) and a well-established long-term uptrend (dark green ribbon). The price action shows higher peaks but lower troughs. Troughs compressed in a minor pullback from just above 146-figure to 144.54. Given the price has closed above the last two peaks, I'm going to give a tick to the price action. The candles since the 23 August low at 144.54 and prior to the recent compression, are demand-side in nature (i.e., white bodies and/or downward pointing shadows). In combination, these technical factors demonstrate a consistent and substantial state of excess demand for the US dollar versus the Japanese yen.
Support is expected at the 144.54 point of demand. Previous points of supply once breached tend to act as future points of demand. For this reason, I also expect solid demand around 145.07. Dynamic support at the short-term trend ribbon should also be expected (144-144.85). There is little in the form of historical points of supply to impede the price action until the next key upside target at the 21 October 2022 major point of supply ay 151.95.
Analysts view: I am comfortable adding risk to USDJPY longs above 144.54 with white candles exhibiting a high session close. The trade would be valid while the USDJPY price continues to close above the short-term trend ribbon.
Stronger than expected Preliminary GDP, Core PCE Price Index, or NFPs: LONG GBPUSD
 Click to enlarge image
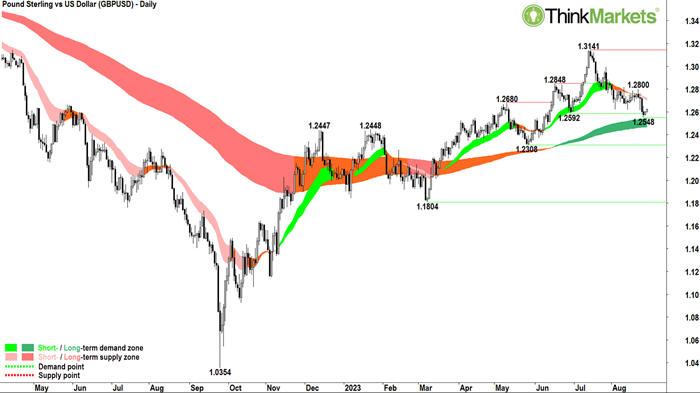
The GBPUSD chart shows the price is in a well-established short-term downtrend (light pink ribbon) compared to a well-established long-term uptrend (dark green ribbon). The price action shows lower peaks and lower troughs. The candles are predominantly supply-side in nature (i.e., black bodies and/or upward pointing shadows). In combination, these technical factors demonstrate substantial excess supply for the Pound Sterling versus the US dollar in the short term versus excess demand in the long term.
The key point of demand is the 25 August low at 1.2548. Beneath this, dynamic demand is expected in the long-term trend ribbon between 1.2470 and 1.2545. This trade is a counter-short term trend trade / pro long-term trend trade aiming at taking advantage of a potential bounce off the long-term trend ribbon. This type of counter-trend setup usually allows for an attractive reward to risk. This is because stops may be set beneath the nearby long-term trend ribbon, with targets considerably higher – in this case, the major point of supply set on 14 July at 1.3143. I will be watching the candles closely for signs intermediate resistance at 1.2800 is causing a problem.
Analysts view: I am comfortable adding risk to GBPUSD longs on the next observed white candle exhibiting a high session close. Preferably, the candle closes near the short-term trend ribbon around 1.2700-figure. Given this is a counter-short-term trend trade it is naturally a higher risk setup. The trade is valid while the GBPUSD price continues to close above the long-term trend ribbon.
Learn More, Earn More!
Want your portfolio questions answered? Register for next week's Live Market Analysis sessions and attend live! You can ask me about any stock, index, commodity, forex pair, or cryptocurrency you're interested in.
REGISTER:
Live Market Analysis Webinars - Macro Wednesdays 3am UTC, USA Stocks Thursdays 2am UTC
You can catch the replay of the last episode of Live Market Analysis here:
Are you prepared for the Bear? Stocks at major crossroad