Please note ThinkMarkets does not provide CFD services to residents of the US.

Please note ThinkMarkets does not provide CFD services to residents of the US.

Learn To Trade
 
Indicators & Chart Patterns

Deepen your knowledge of technical analysis indicators and hone your skills as a trader.

Find your detailed guides here
Live Webinars

Boost your knowledge with our live, interactive webinars delivered by industry experts.

Learn More
Trading Glossary

From beginners to experts, all traders need to know a wide range of technical terms. Let us be your guide.

Learn more
Knowledge Base

No matter your experience level, download our free trading guides and develop your skills.

Learn more
Learn To Trade

Trade smarter: boost your skills with our training resources.

Create a live account
Market Analysis
 
Market News

All the latest market news, with regular insights and analysis from our in-house experts

Learn more
Economic Calendar

Make sure you are ahead of every market move with our constantly updated economic calendar.

Learn more
Technical Analysis

Harness past market data to forecast price direction and anticipate market moves.

Learn more
Live Webinars

Boost your knowledge with our live, interactive webinars delivered by industry experts.

Register now
Special Reports

Engaging, in-depth macroeconomic analysis and expert educational content from our in-house analysts

Learn more
Market Analysis

Harness the market intelligence you need to build your trading strategies.

Create a live account
About ThinkMarkets
 
Sponsorships

Check out our sponsorships with global institutions and athletes, built on shared values of excellence.

Learn more
About Us

Find out more about ThinkMarkets, an established, multi-award winning global broker you can trust.

Learn more
Careers

Discover a range of rewarding career possibilities across the globe

Apply now
ThinkMarkets News

Keep up to date with our latest company news and announcements

Learn more
Trading Infrastructure

When it comes to the speed we execute your trades, no expense is spared. Find out more.

Learn more
Contact Us

Our multilingual support team is here for you 24/7.

Learn more
About ThinkMarkets

Global presence, local expertise - find out what sets us apart.

Create a live account
Log in Create account

Where next after the S&P 500 hits a new all-time high?

Alejandro Zambrano Alejandro Zambrano 23/01/2024
Where next after the S&P 500 hits a new all-time high? Where next after the S&P 500 hits a new all-time high?
Where next after the S&P 500 hits a new all-time high? Alejandro Zambrano

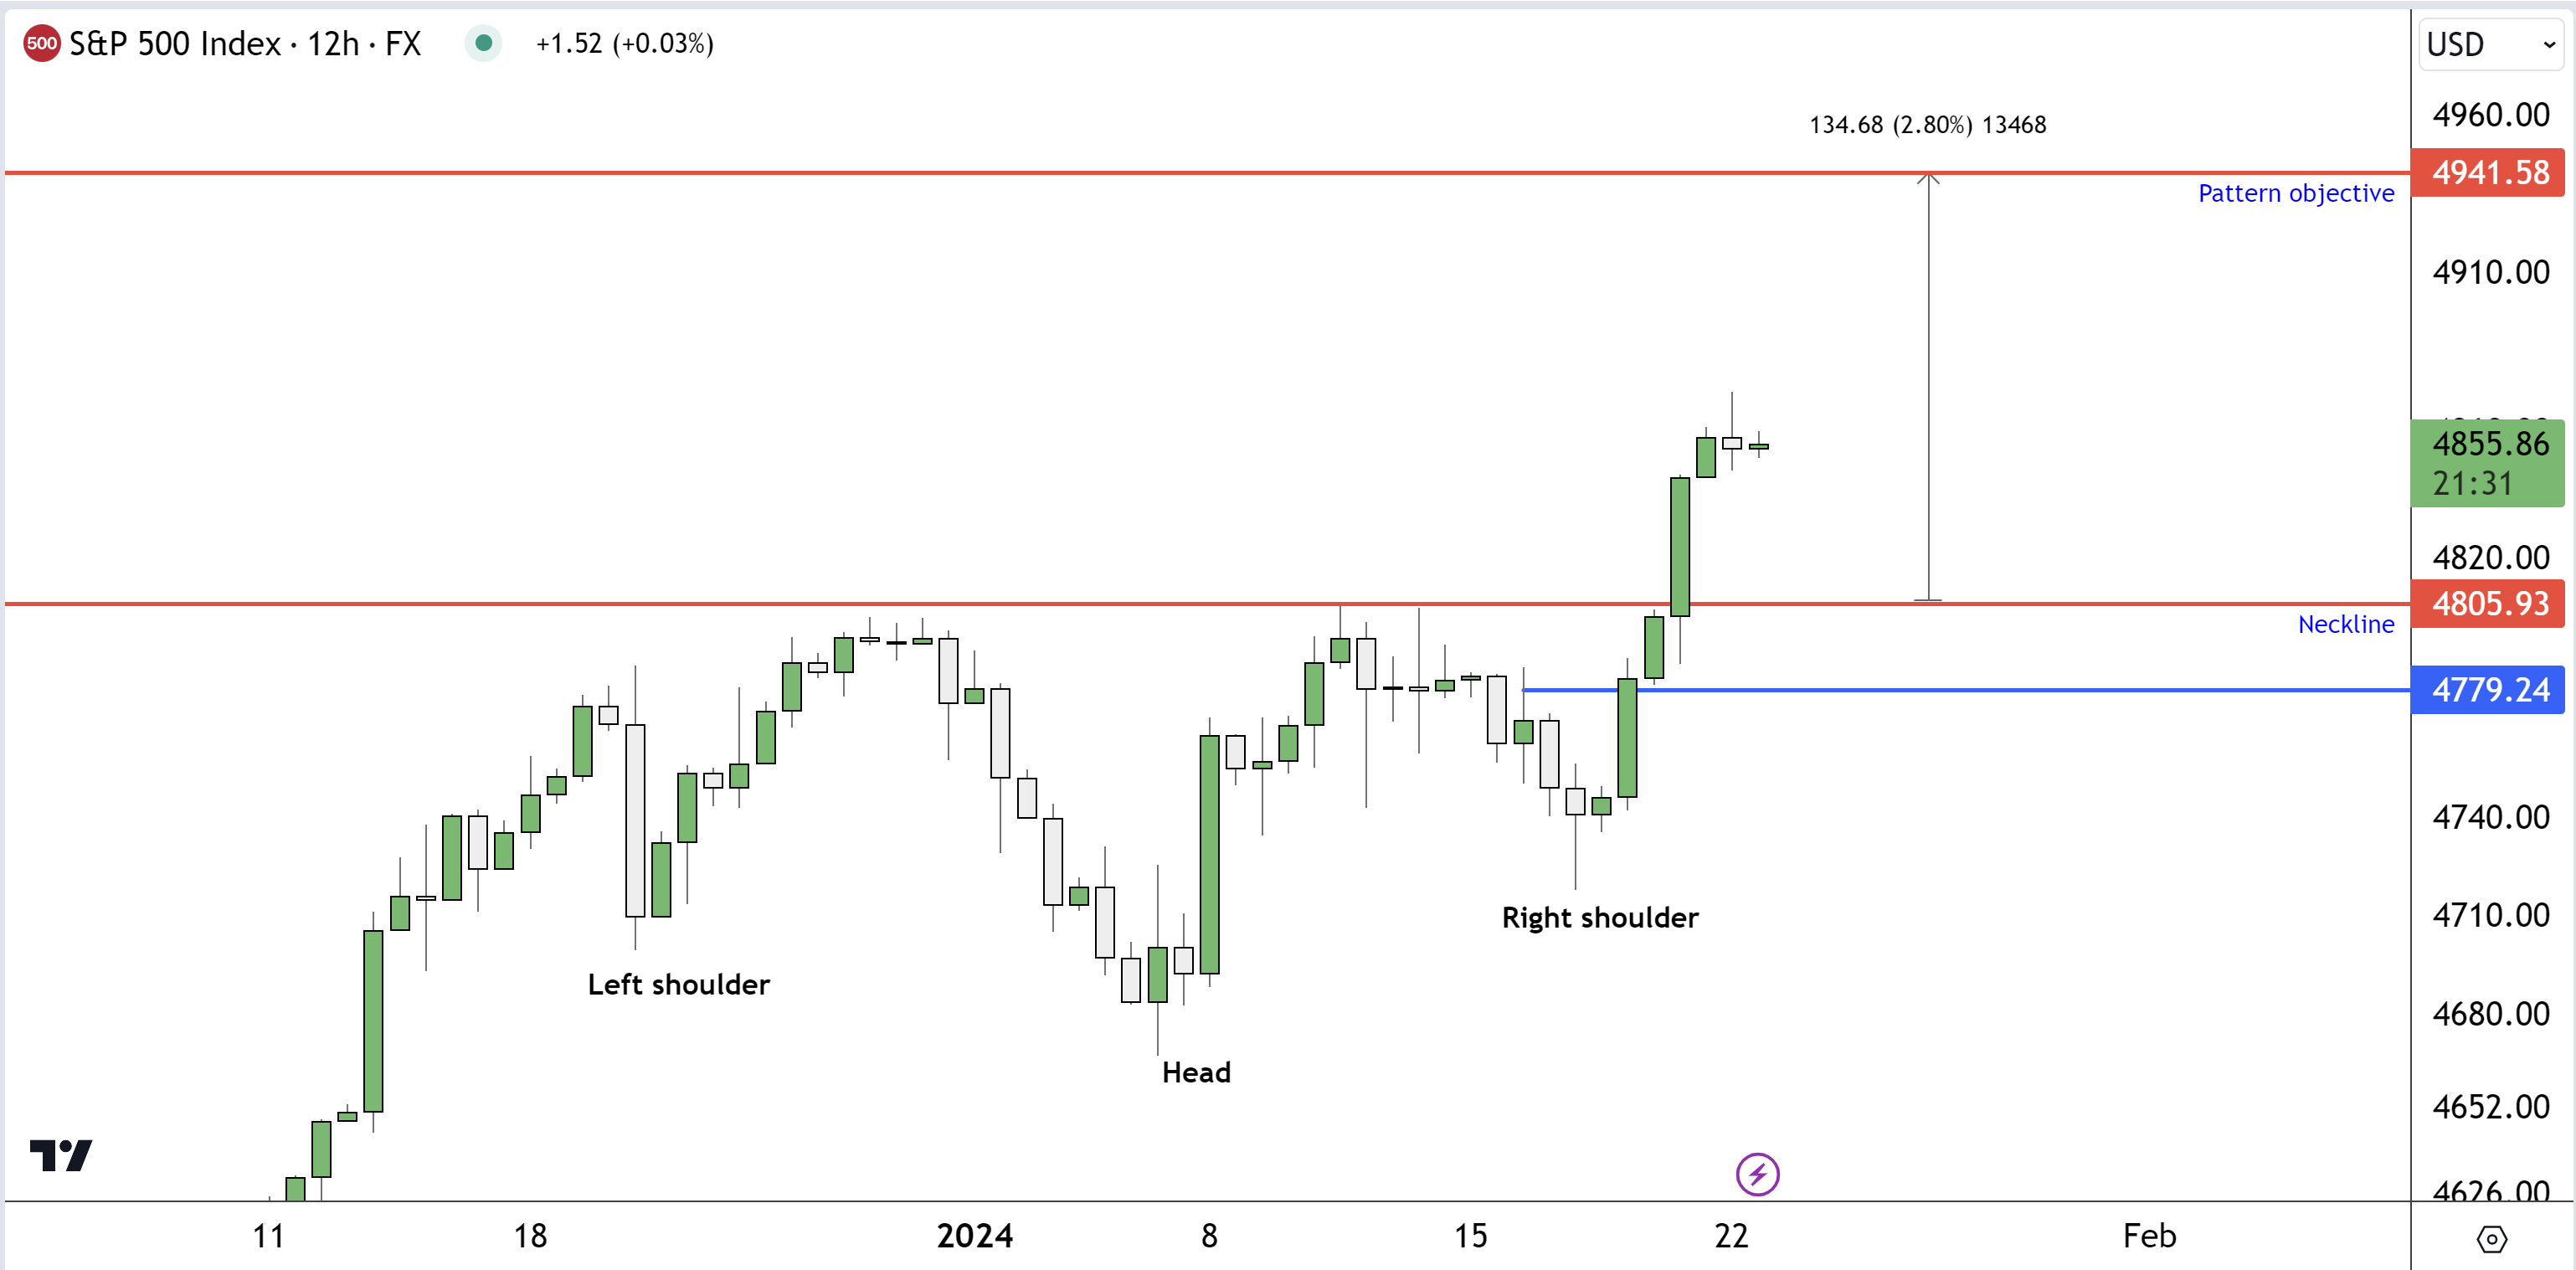
The S&P 500 futures reached another all-time high on Monday, January 22, 2024. This was not a surprise for traders using classical chart patterns as the index had carved out an inverse head and shoulders pattern since December 18, 2023.  
 

The pattern is called the head and shoulders pattern, as it looks like the shape of a human. In the chart below, we look at this pattern's inverse. The left shoulder, as annotated in the chart, is followed by the lower low, the head, and a higher low, called the right shoulder. Where there are local high intercepts, we add a line called the neckline. As this line is breached, the pattern is activated. The difference between the neckline and the lowest point of the pattern, the “head”, is added to the neckline. In the case of the S&P 500 today, it suggests that the index could reach as high as 4941. The pattern will remain in play as long as the price does not trade deeply back into the pattern by trading below the 4779 level.  


Why is the S&P 500 rising?  

The S&P 500 is rising as the market has realised that the world and US economy can cope with high interest rates, as shown by last week’s better-than-expected US retail sales, and US jobless claims remain low. The same interest rates spooking the markets are now expected to turn lower by summer at the latest. Also, leading indicators like the PMIs are anticipated to rise, suggesting the world economy is turning the corner. 
 

What are the challenges that the S&P 500 is facing?  

The famed CNN Fear and Greed index, which suggested buying in October and November of 2023, was correct; the market was dominated by extreme fear. The same index is now at excessive greed levels after the S&P 500 rose 18% from its November low. In other words, it tells us to be agile and ready for a more significant correction. So, what is right, the charts of the fear and greed index? My preference is to combine both and place extra weight on the charts, which suggests we should remain bullish for now.
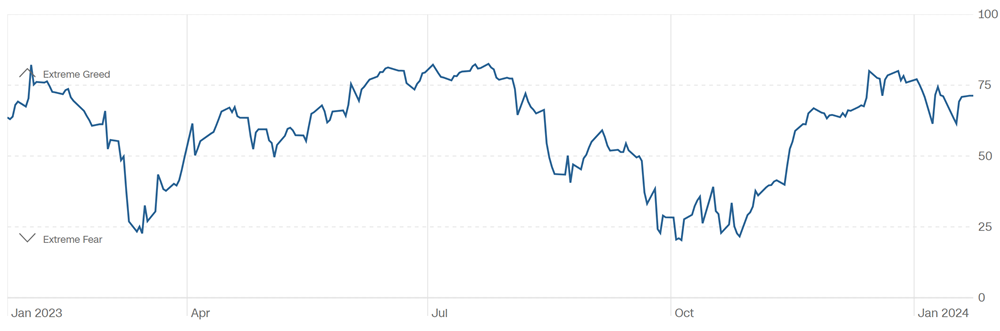
Source: CNN
 

Any opinions, news, research, analyses, prices or other information contained on this website is provided as general market commentary and does not constitute investment advice. ThinkMarkets will not accept liability for any loss or damage including, without limitation, to any loss of profit which may arise directly or indirectly from use of or reliance on such information.

Related articles:

Pound Sterling's Tightrope: Navigating the Na...

By Alejandro Zambrano

30/01/2024

Bitcoin’s Price Plummets After ETF Approval

By Alejandro Zambrano

24/01/2024

From ETFs to Halvings: Unpacking Bitcoin's re...

By Alejandro Zambrano

24/10/2023

Global markets shaken by Middle East tensions...

By Alejandro Zambrano

17/10/2023

Crude oil prices spike by 5.5% amidst geopoli...

By Alejandro Zambrano

09/10/2023

Any opinions, news, research, analyses, prices or other information contained on this website is provided as general market commentary and does not constitute investment advice. ThinkMarkets will not accept liability for any loss or damage including, without limitation, to any loss of profit which may arise directly or indirectly from use of or reliance on such information.
Back to top