Please note ThinkMarkets does not provide CFD services to residents of the US.

Please note ThinkMarkets does not provide CFD services to residents of the US.

Learn To Trade
 
Indicators & Chart Patterns

Deepen your knowledge of technical analysis indicators and hone your skills as a trader.

Find your detailed guides here
Trading Glossary

From beginners to experts, all traders need to know a wide range of technical terms. Let us be your guide.

Learn more
Knowledge Base

No matter your experience level, download our free trading guides and develop your skills.

Learn more
Learn To Trade

Trade smarter: boost your skills with our training resources.

Create a live account
Market Analysis
 
Market News

All the latest market news, with regular insights and analysis from our in-house experts

Learn more
Economic Calendar

Make sure you are ahead of every market move with our constantly updated economic calendar.

Learn more
Technical Analysis

Harness past market data to forecast price direction and anticipate market moves.

Learn more
Live Webinars

Boost your knowledge with our live, interactive webinars delivered by industry experts.

Register now
Special Reports

Engaging, in-depth macroeconomic analysis and expert educational content from our in-house analysts

Learn more
Market Analysis

Harness the market intelligence you need to build your trading strategies.

Create a live account
Partnership
 
Affiliate Programme

Grow your business and get rewarded. Find out more about our Affiliate Programme today.

Learn more
Introducing Broker

ThinkMarkets ensures high levels of client satisfaction with high client retention and conversion rates.

Learn more
Proprietary Trading

Partner with us to build your own prop trading business. Enquire with our account managers today.

Learn more
White Label

We supply everything you need to create your own brand in the Forex industry.

Learn more
Regional Representatives

Partner with ThinkMarkets today to access full consulting services, promotional materials and your own budgets.

Learn more
Refer a friend

Receive $50 for you and your friend when you convert them into an active trader of ThinkMarkets.

Learn more
Partnership

Plug into the next-gen platforms and the trades your clients want.

Partner Portal
About ThinkMarkets
 
Sponsorships

Check out our sponsorships with global institutions and athletes, built on shared values of excellence.

Learn more
About Us

Find out more about ThinkMarkets, an established, multi-award winning global broker you can trust.

Learn more
Careers

Discover a range of rewarding career possibilities across the globe

Apply now
ThinkMarkets News

Keep up to date with our latest company news and announcements

Learn more
Trading Infrastructure

When it comes to the speed we execute your trades, no expense is spared. Find out more.

Learn more
Contact Us

Our multilingual support team is here for you 24/7.

Learn more
About ThinkMarkets

Global presence, local expertise - find out what sets us apart.

Create a live account
Log in Create account

What is the Average True Range (ATR) indicator?

The Average True Range indicator, or ATR, is an indicator that measures the market volatility of a financial asset by analyzing the range of price for a defined period of candles. It is used as a measure of volatility and is quite often used by traders to determine how far a particular move may go.

While it can be used with any timeframe, the original form of ATR was used on a daily chart to analyze the range of the last 14 days.

The ATR suggests if a market is overbought or oversold, specifically whether or not it has moved much further than it typically would.

It is quite common for short-term prop traders to base their position on whether or not the market is likely to continue going forward before closing out to go home. Longer-term traders tend to use it on higher time frames to see when a potential pullback or bounce could occur.
Adding the ATR to your charts on MT4 and MT5 In order to add the Average True Range indicator to your charts, you need to click the 'Insert' menu, the ‘Indicators’ submenu, the ‘Oscillators’ submenu, and then choose ‘Average True Range’.

Once you do this, you will see the indicator open up on a window underneath the price, just as you would any other oscillator.

In this example below, you can see that the ATR shows a signal line that goes up and down, in this case with the lowest band being the 0.0108 level, with the 0.0318 level above being the top range.

Average true range


Notice how the line goes up and down, and this is the crux of the indicator.

At the top left corner of the ATR section, you can see that it has the reading of 0.0309, telling us that the GBP/AUD pair has an average range of 309 pips per candle over the last 14 candles.

In this example, that means 309 pips per day:

The ATR on a chart

Now that the indicator is attached to your charting platform, we can start to discuss how this can become crucial information for those looking to trade the currency markets.
Practise trading with $25,000 virtual funds
How to use the ATR
The most common way is to pay attention to how big a move the market could potentially make during a given trading session.

For example, think about the GBP/AUD pair mentioned previously. If the average range of trading during the previous 14 days was 309 pips, this is crucial information if you are trading short-term charts.

For example, wouldn’t it be valuable information to know whether or not a market was likely to continue moving further after making an initial charge?

If you find yourself in an uptrend that has already moved 290 pips, then you know it’s very unlikely that we will continue further, all things being equal.

Obviously, this doesn’t have to be the case, but it is one way that short-term traders will gauge whether or not they should stay in a move.

On the other hand, in that same scenario you may have seen that the market has rallied 45 pips, but has the ATR reading of 309. In that scenario, a short-term trader will typically look at this as an opportunity to hang onto the trade for a bigger move.

Granted, some traders will use the five-minute chart to trade, and the one-hour chart for the ATR. Others will use the daily chart to figure this out, just as the example above shows. In the end, it comes down to your trading style.
  • ATR can give you an idea of how far a move can go
  • ATR does and can change in extreme conditions
  • ATR measures the size of the range, not necessarily the direction

When you place a trade and the ATR is added at an extraordinarily low level, this tells you the trading opportunities are probably going to be short-term at best, and for small profits.

Quite often, traders will scan multiple charts to see what the ATR reading is, and therefore look for those with larger readings. This means there are more possibilities and therefore more profits if you get it right. Some traders will also recognize that a reading that is expanding to the upside could also lead to longer term trades if so inclined.
Join thousands of traders who choose a mobile-first broker.
The EMA and the ATR As with most indicators, the ATR should be used just on its own. Without a doubt, the most important thing on a chart is price. Furthermore, trends should be paid attention to as well.

This is where the EMA comes and as it defines a trend quite plainly. Take a look at the chart below:
 

Using the ATR and 20 EMA to stay with a trend


Notice that the 20-day EMA has been sloping lower for several months. You can see clearly that the market had initially used it as support, but then found it to be rather resistive.

Beyond that, the ATR reading was relatively low until the last couple of weeks. Notice how the ATR is expanding. This is crucial information for short-term traders, and they will certainly use this daily chart as a bit of a guideline for day trading the NZD/CHF pair.

By paying attention to the overall trend in the fact that volatility is certainly growing, short-term traders will be able to sell this market on signs of exhaustion and take advantage of the downtrend overall. You can see clearly that sellers had been in control, even though there were times where the market rallied a bit, but they also sold after that short-term rally.

For the shorter-term trader, this market has offered plenty of opportunities due to not only trading with the overall downtrend but recognizing that the market is starting to expand its reach per session. In this particular example, the market had initially been moving at roughly 37 pips a day, but by the time the trader started to see extreme volatility, it had increased to an average of 107 pips a day.

For those trading short-term charts, a range that is over 100 pips per session offered plenty of room for trades to move. In this sense, the ATR has nothing to do with your system, it just gives you an idea as to whether or not there is plenty of opportunity in the particular currency pair.

For example, the trader that uses the ATR indicator to tell how far a market could move might be trading the five minute charts, shorting every shooting star candlestick formation that they see. They may also use something like a large, round, psychologically significant figure on that same short-term chart. By only selling and hanging onto trades for longer as the ATR has risen, they are on the right side of the trade, and are collecting more profits than they may have if they had not used the Average True Range indicator.

The Average True Range indicator is also used for stop loss placement.

For example, if the Average True Range is 100 pips, then those placing a trade off of the daily chart could for example place a stop loss 100 pips from the entry, knowing that if the market were to go 100 pips against you, something has certainly changed as far as volatility is concerned, and it most certainly is working against you. If that’s going to be the case, then it’s time to bail out of the marketplace.

Depending on what your risk appetite is, you can adjust your position size to fit that 100 pip ATR. In other words, if you have a 2% risk appetite per trade, then you just make sure that the 100 pips that you are basing your trade off of as far as the stop loss is concerned, doesn’t measure more than 2% of your account.
Start trading GER40 from as low as 0.4 pips with ThinkTrader
Some things to pay attention to
As mentioned in the bullet points above, the Average True Range indicator doesn’t tell you which direction the price of a security is going, only that it is moving more or less as opposed to the range. This is the range between the low and the high of the day and doesn’t take into account the shape of the candlestick, as an example.

The Average True Range indicator is used by a lot of professional traders us. They don’t tend to hold trades over the longer term, unless they are part of some type of investment firm. Your typical prop trader or day trader is going to be flat overnight, so they don’t have to worry about positions while sleeping.

Beyond that, the ATR gives them an idea of how much the market is going to move per session, so they can use that in the morning when they show up.

A lot of the same traders will scan the charts first thing in the morning to get an idea as to which markets offer the most opportunity. Remember, as a trader you need to see volatility in order to make money. A currency pair that has a very low ATR typically is an offering much in the way of profits, unless of course you are looking for some type of grinding and range bound market, which there are strategies built for.

Nonetheless, most traders don’t trade like that so the higher the ATR reading, the typically more attractive the pair will be. That being said, it also can suggest that there is more danger. Remember, where there is risk, there is reward but you need to do so in an intelligent manner, which is where using the ATR as an idea for the stop loss comes into play.

Unlike other oscillators, ATR doesn’t necessarily offer much in the way of divergence trading, which is a standard of other ones such as:
  • The MACD
  • Stochastic Oscillator
  • Commodity Channel Index

In the past few years, some traders have found that using a longer-term ATR as being effective.

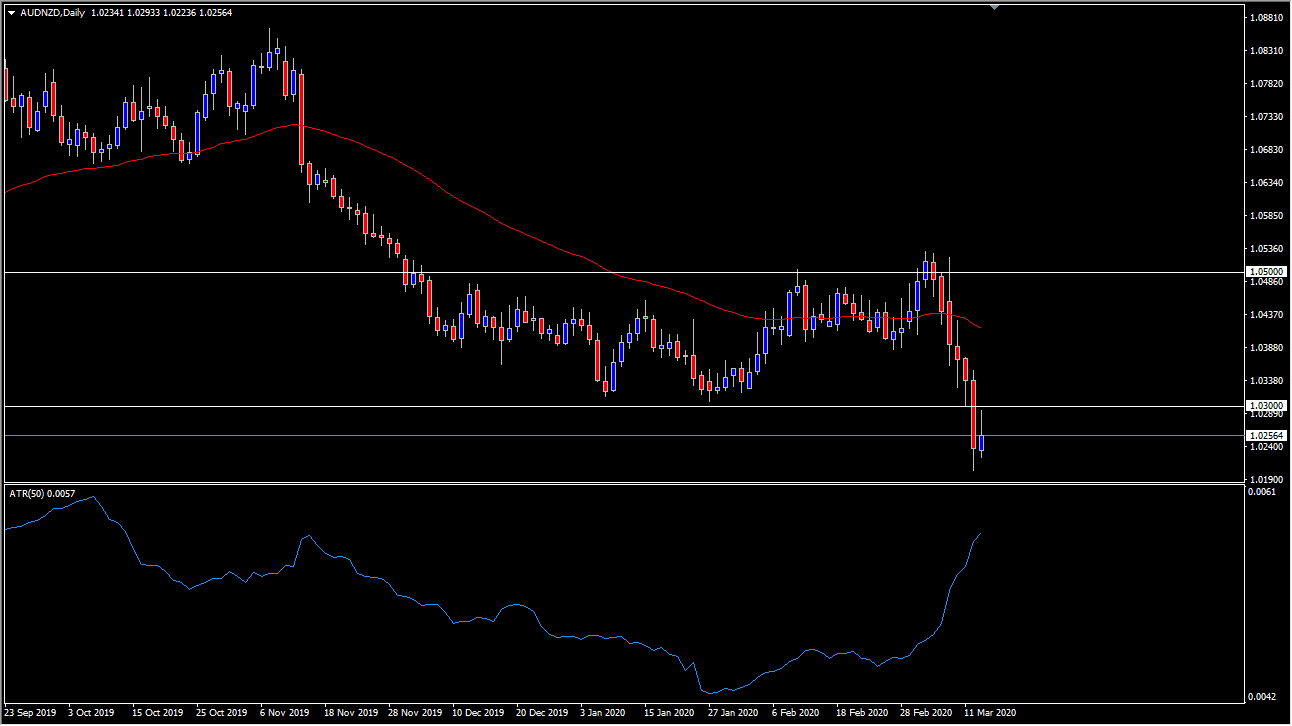
One of the more common readings is 20 candles, but the default reading is 14. Some longer-term trend traders will even use higher timeframe reading such as 50 on a daily chart. As the 50 day EMA is very common, quite often you will see a 50 ATR on a daily chart married with the 50-day EMA.

In the chart below, you can see how the 50-day EMA keeps you on the right side of the trend, and the ATR tells you when it’s time to expect bigger moves and hanging onto that short-term trade a little longer. Notice how the ATR was relatively sideways for a while, right along with the 50 day EMA. As the 50 day EMA is starting to rollover, the ATR is climbing rapidly, which of course leads to trading opportunities.
  A chart with 50 EMA and 50 ATR

While the ATR isn’t necessarily the most sophisticated approach to technical analysis, it can keep you out of serious trouble. If you have missed a market move, you know it is very unlikely that entering a new trade would make sense.

Another thing to think about is that algorithms tend to use ATR a lot as well, as they focus on short-term setups typically. Because of this, it can also keep you on the correct side of prop shops and larger short-term funds.
Any opinions, news, research, analyses, prices or other information contained on this website is provided as general market commentary and does not constitute investment advice. ThinkMarkets will not accept liability for any loss or damage including, without limitation, to any loss of profit which may arise directly or indirectly from use of or reliance on such information.
Back to top