Please note ThinkMarkets does not provide CFD services to residents of the US.

Please note ThinkMarkets does not provide CFD services to residents of the US.

Learn To Trade
 
Indicators & Chart Patterns

Deepen your knowledge of technical analysis indicators and hone your skills as a trader.

Find your detailed guides here
Trading Glossary

From beginners to experts, all traders need to know a wide range of technical terms. Let us be your guide.

Learn more
Knowledge Base

No matter your experience level, download our free trading guides and develop your skills.

Learn more
Learn To Trade

Trade smarter: boost your skills with our training resources.

Create a live account
Market Analysis
 
Market News

All the latest market news, with regular insights and analysis from our in-house experts

Learn more
Economic Calendar

Make sure you are ahead of every market move with our constantly updated economic calendar.

Learn more
Technical Analysis

Harness past market data to forecast price direction and anticipate market moves.

Learn more
Live Webinars

Boost your knowledge with our live, interactive webinars delivered by industry experts.

Register now
Special Reports

Engaging, in-depth macroeconomic analysis and expert educational content from our in-house analysts

Learn more
Market Analysis

Harness the market intelligence you need to build your trading strategies.

Create a live account
Partnership
 
Affiliate Programme

Grow your business and get rewarded. Find out more about our Affiliate Programme today.

Learn more
Introducing Broker

ThinkMarkets ensures high levels of client satisfaction with high client retention and conversion rates.

Learn more
Proprietary Trading

Partner with us to build your own prop trading business. Enquire with our account managers today.

Learn more
White Label

We supply everything you need to create your own brand in the Forex industry.

Learn more
Regional Representatives

Partner with ThinkMarkets today to access full consulting services, promotional materials and your own budgets.

Learn more
Refer a friend

Receive $50 for you and your friend when you convert them into an active trader of ThinkMarkets.

Learn more
Partnership

Plug into the next-gen platforms and the trades your clients want.

Partner Portal
About ThinkMarkets
 
Sponsorships

Check out our sponsorships with global institutions and athletes, built on shared values of excellence.

Learn more
About Us

Find out more about ThinkMarkets, an established, multi-award winning global broker you can trust.

Learn more
Careers

Discover a range of rewarding career possibilities across the globe

Apply now
ThinkMarkets News

Keep up to date with our latest company news and announcements

Learn more
Trading Infrastructure

When it comes to the speed we execute your trades, no expense is spared. Find out more.

Learn more
Contact Us

Our multilingual support team is here for you 24/7.

Learn more
About ThinkMarkets

Global presence, local expertise - find out what sets us apart.

Create a live account
Log in Create account

What is a hanging man candlestick pattern?

The hanging man pattern is a single-candle formation found at the top of an uptrend.

This pattern is popular amongst traders as it is considered a reliable tool for predicting changes in the trend direction.

A hanging man is considered a bearish candlestick pattern that issues a warning that the market may reverse soon as the bulls appear to be losing momentum.

The reversal may not start as soon as the hanging man is formed. Instead, it generates a message that the current momentum may be in its closing stages as the price action prepares for a potential change in the trend direction.
Characteristics of the Hanging Man pattern
The hanging man belongs to a family of single-candle formations.

This candle is created when the open, high, and close are of a similar price, while there is a long shadow to the downside. Ideally, this shadow, or wick, should be at least twice the length of the body.

Hanging man pattern samples

Similar to other candlestick patterns, the hanging man is a representative of the current market sentiment.

As it is a bearish formation, it occurs at the top of an uptrend. Despite a high closing price, a long shadow that extends lower signals that an increasing number of bears are participating in the market.

Thus, the rise of bears can only occur at the expense of the bulls, who have been in control of the price action up to this point. An extensive selling pressure was present during a part of the session which created a wick, although the bulls forced a close near the session’s high.

The message is simple: don’t be surprised if the reversal takes place soon.
Practise trading with $25,000 virtual funds
Positive and negative energy aspects
The obvious strength of the hanging man pattern is that it suggests a potential change in the price direction.

On the other hand, the pattern is still a technical indicator. There is a message that conveys from the market, but that shouldn’t be taken directly as a signal. If we traded all signs from the market, we would end up in having tens and tens of opened trades on a daily basis.

Hence, the takeaway is consistent with other candlestick patterns. It’s wise to consult other technical tools and aspects of the process to verify the validity of a signal issued by the hanging man pattern.
Identifying the hanging man pattern As a single candle, the hanging man pattern is quite easy to spot, especially due to its long wick lower that tends to stick out.

On the chart below, we have a EUR/USD hourly chart where the price action moves upside. Since this is a bearish reversal pattern, the trend must always be positive and bullish for a hanging man pattern to occur.

How to spot the pattern

In a short time frame, two hanging man candles are formed. The first candle hints that a reversal may take place, which is then confirmed with a long bearish candle afterwards. It’s a choppy price action so the price continues to trade without much clarity.

Later, the price action forms the second hanging man pattern, followed by a bearish candle and a doji. All these candles signal that the reversal is imminent, a scenario that materializes shortly afterwards.
Join thousands of traders who choose a mobile-first broker.
Trading the hanging man formation Let’s look at another example.

At the point marked ‘1’, the price action trades sideways before there is a bullish push higher to break out of the trading range. At one point, the price action forms the hanging man, which is then confirmed by the next candle, and the reversal is set in motion. Ultimately, the price action moves below the previous swing low to create a new short term low.

How to trade the hanging man pattern

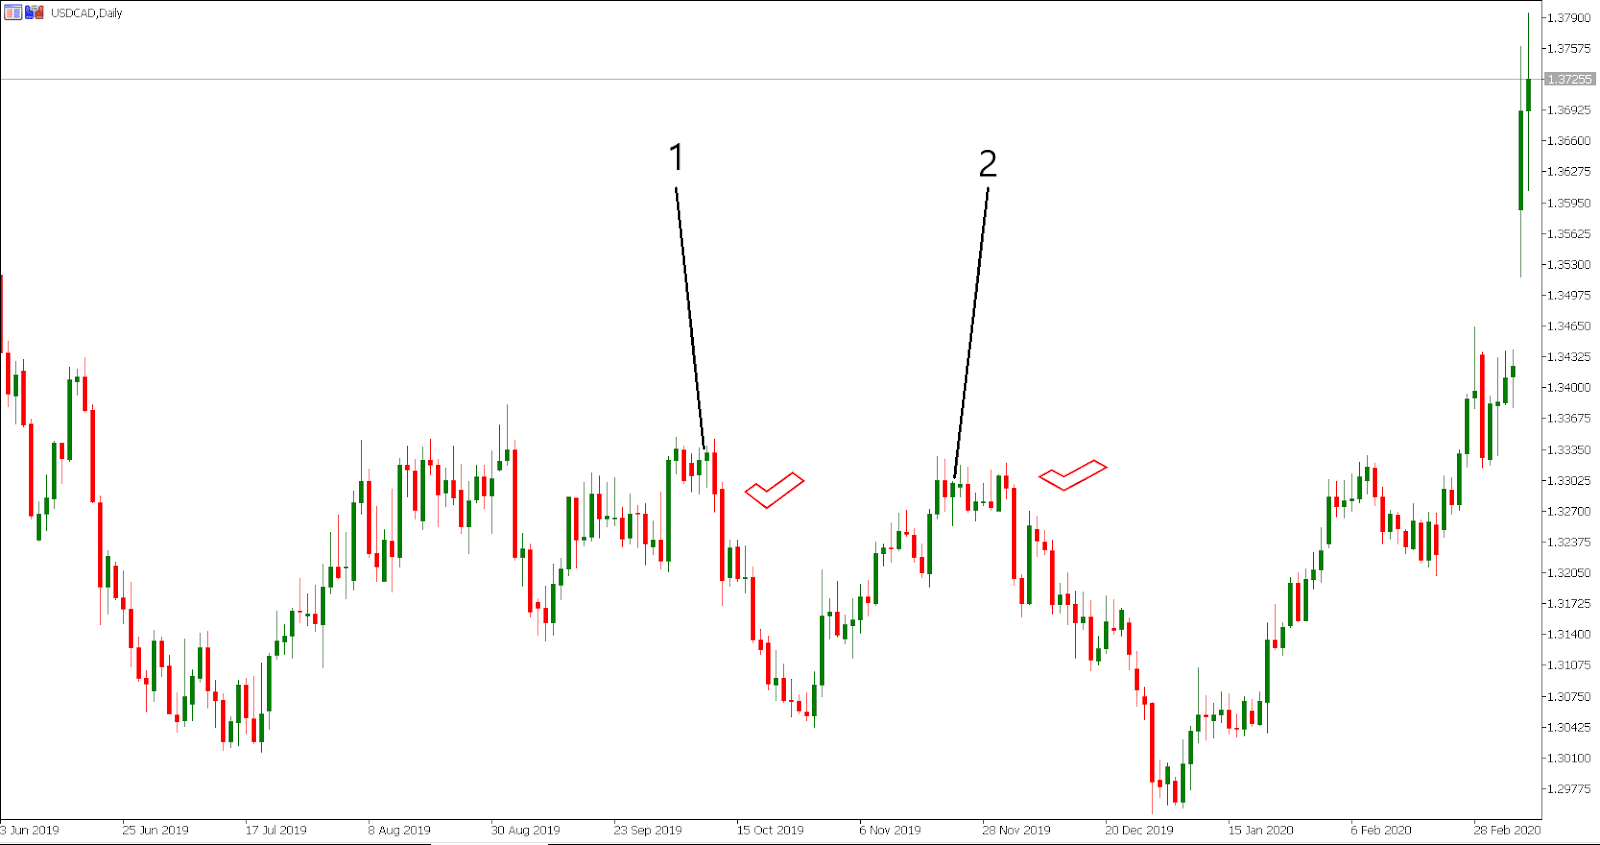
The situation at the point marked ‘2’ is different since there is a clean push higher before the hanging man is created.

In this case, the reversal doesn’t occur immediately after the hanging man is formed, but the price action moves from a bullish trend to a consolidation phase. Ultimately, the price moves to the downside to print even lower levels than during the first pullback.

In both these situations, a hanging man played a part in the correction process. These two examples show the essence of this pattern as it only generates a signal of a potential reversal and other indicators are needed to build a more complete picture.

A stop-loss should be placed above the most recent high as the new high would imply a continuation of the same trend. Take profit orders depend on your trading style and here it is also advised to use other indicators to identify levels of support.
Any opinions, news, research, analyses, prices or other information contained on this website is provided as general market commentary and does not constitute investment advice. ThinkMarkets will not accept liability for any loss or damage including, without limitation, to any loss of profit which may arise directly or indirectly from use of or reliance on such information.
Start trading GER40 from as low as 0.4 pips with ThinkTrader
Back to top