With millions of people opening their wallets to spend on crazy deals and sales, some individuals choose Black Friday to enter the stock market instead. While others are spending money, they trade stocks and indices with the potential to earn.
What is Black Friday?
In the 1940s, "Black Friday" was coined to describe the heavy and disruptive pedestrian and vehicle traffic that would occur the day after Thanksgiving—this day marked the unofficial beginning of the holiday shopping season. Initially, it was a phrase used more in caution than celebration, linked to the chaos of traffic and vehicular accidents.
However, as time progressed, the term evolved and adopted a more positive spin. By the latter part of the 20th century, "Black Friday" began getting associated with the notion of businesses moving from "red" (losses) to "black" (profits), as their sales on this day significantly boosted their revenues. This transition symbolised a shift in the day's significance, from a day of hectic traffic to a day of crucial economic importance for retailers.
In the last few decades, retailers began to embrace Black Friday as a golden opportunity for marketing. They offered special deals and extended shopping hours, making the day a cultural phenomenon. By the early 2000s, this day had firmly established itself as the busiest shopping day of the year, not just in the United States but increasingly in other parts of the world.
Trading around Black Friday
In an article published by Quantified Strategies, a simple strategy of buying the S&P 500 cash index on the Friday before Thanksgiving, (17 November), and closing the position on Black Friday, 24 November, would provide a return of 46.79% if done every year since 1960.
The average gain per trade equates to 0.64%, and the win ratio is 68%, meaning that a majority of the trades would be profitable. However, the strategy is not without risk. If one would indeed have traded the strategy since 1960, the trader would have experienced a max drawdown of 7%. The Quantified Strategies author concludes: “The gain is higher than for any random week during the year.”
What if we hold on to an S&P 500 position beyond Black Friday?
In a 2022 article by Yahoo Finance, the Monday following Black Friday is usually a losing day for the S&P 500. The typical loss would be 0.23%, with only 41% of days being positive since 1990. These results tie in with the strategy of Quantified Strategies.
The Yahoo article can also teach us something else. The trading week following Black Friday indicates what may happen with the market in the next three months. In instances where the S&P 500 (SPX 500) saw an increase of at least 1% in the week succeeding Black Friday, the subsequent three-month period averaged returns of 3.9%, with upwards of 80% being favourable. On the other hand, if the week after Black Friday marked a downturn of 1% or more, the index generally recorded an average fall of 4.6%, with positive returns constituting merely 33%.
What stocks to buy?
You might think buying the shares of companies like Amazon and Walmart might be a good idea. But statistics show that in the last ten years, these two firms tend to lose 0.60% and 0.64% on average in the week following Black Friday. Instead, stocks like HP and Nike tend to outperform the markets.
As always, when historical relationships might break down, using more than backwards-looking data is important in trading.
Check out how your trading strategies would have performed in the past Black Fridays using our FREE backtesting tool, exclusive on ThinkTrader web. Dive into the historical data to refine your approach for the upcoming Black Friday weekend.
NIKE trade sideways ahead of Black Friday
Seen from perspective of a long-term investor, the share price is up dramatically. In the early 2000s, Nike (ticker: NKE) traded around 5 dollars a share, providing a 20x on the investment. However, in the last four years, NKE has been trading sideways. The development has been dire for long-term buyers, but the situation is ripe for people interested in buying today.
From a technical perspective, the price is trading sideways between $88 and $115.45, and a break to either side of this range could ignite a new trend. The price is also trading inside a triangle, and this pattern is the most interesting. We have highlighted the pattern in the chart below using the blue lines. If the price breaks out above the downward trending line, we could see a 66-dollar move. In comparison, a break to the lower end of the pattern could send the price lower by 40 dollars. However, given the success of Nike and its position in the market, I estimate this scenario is less likely.
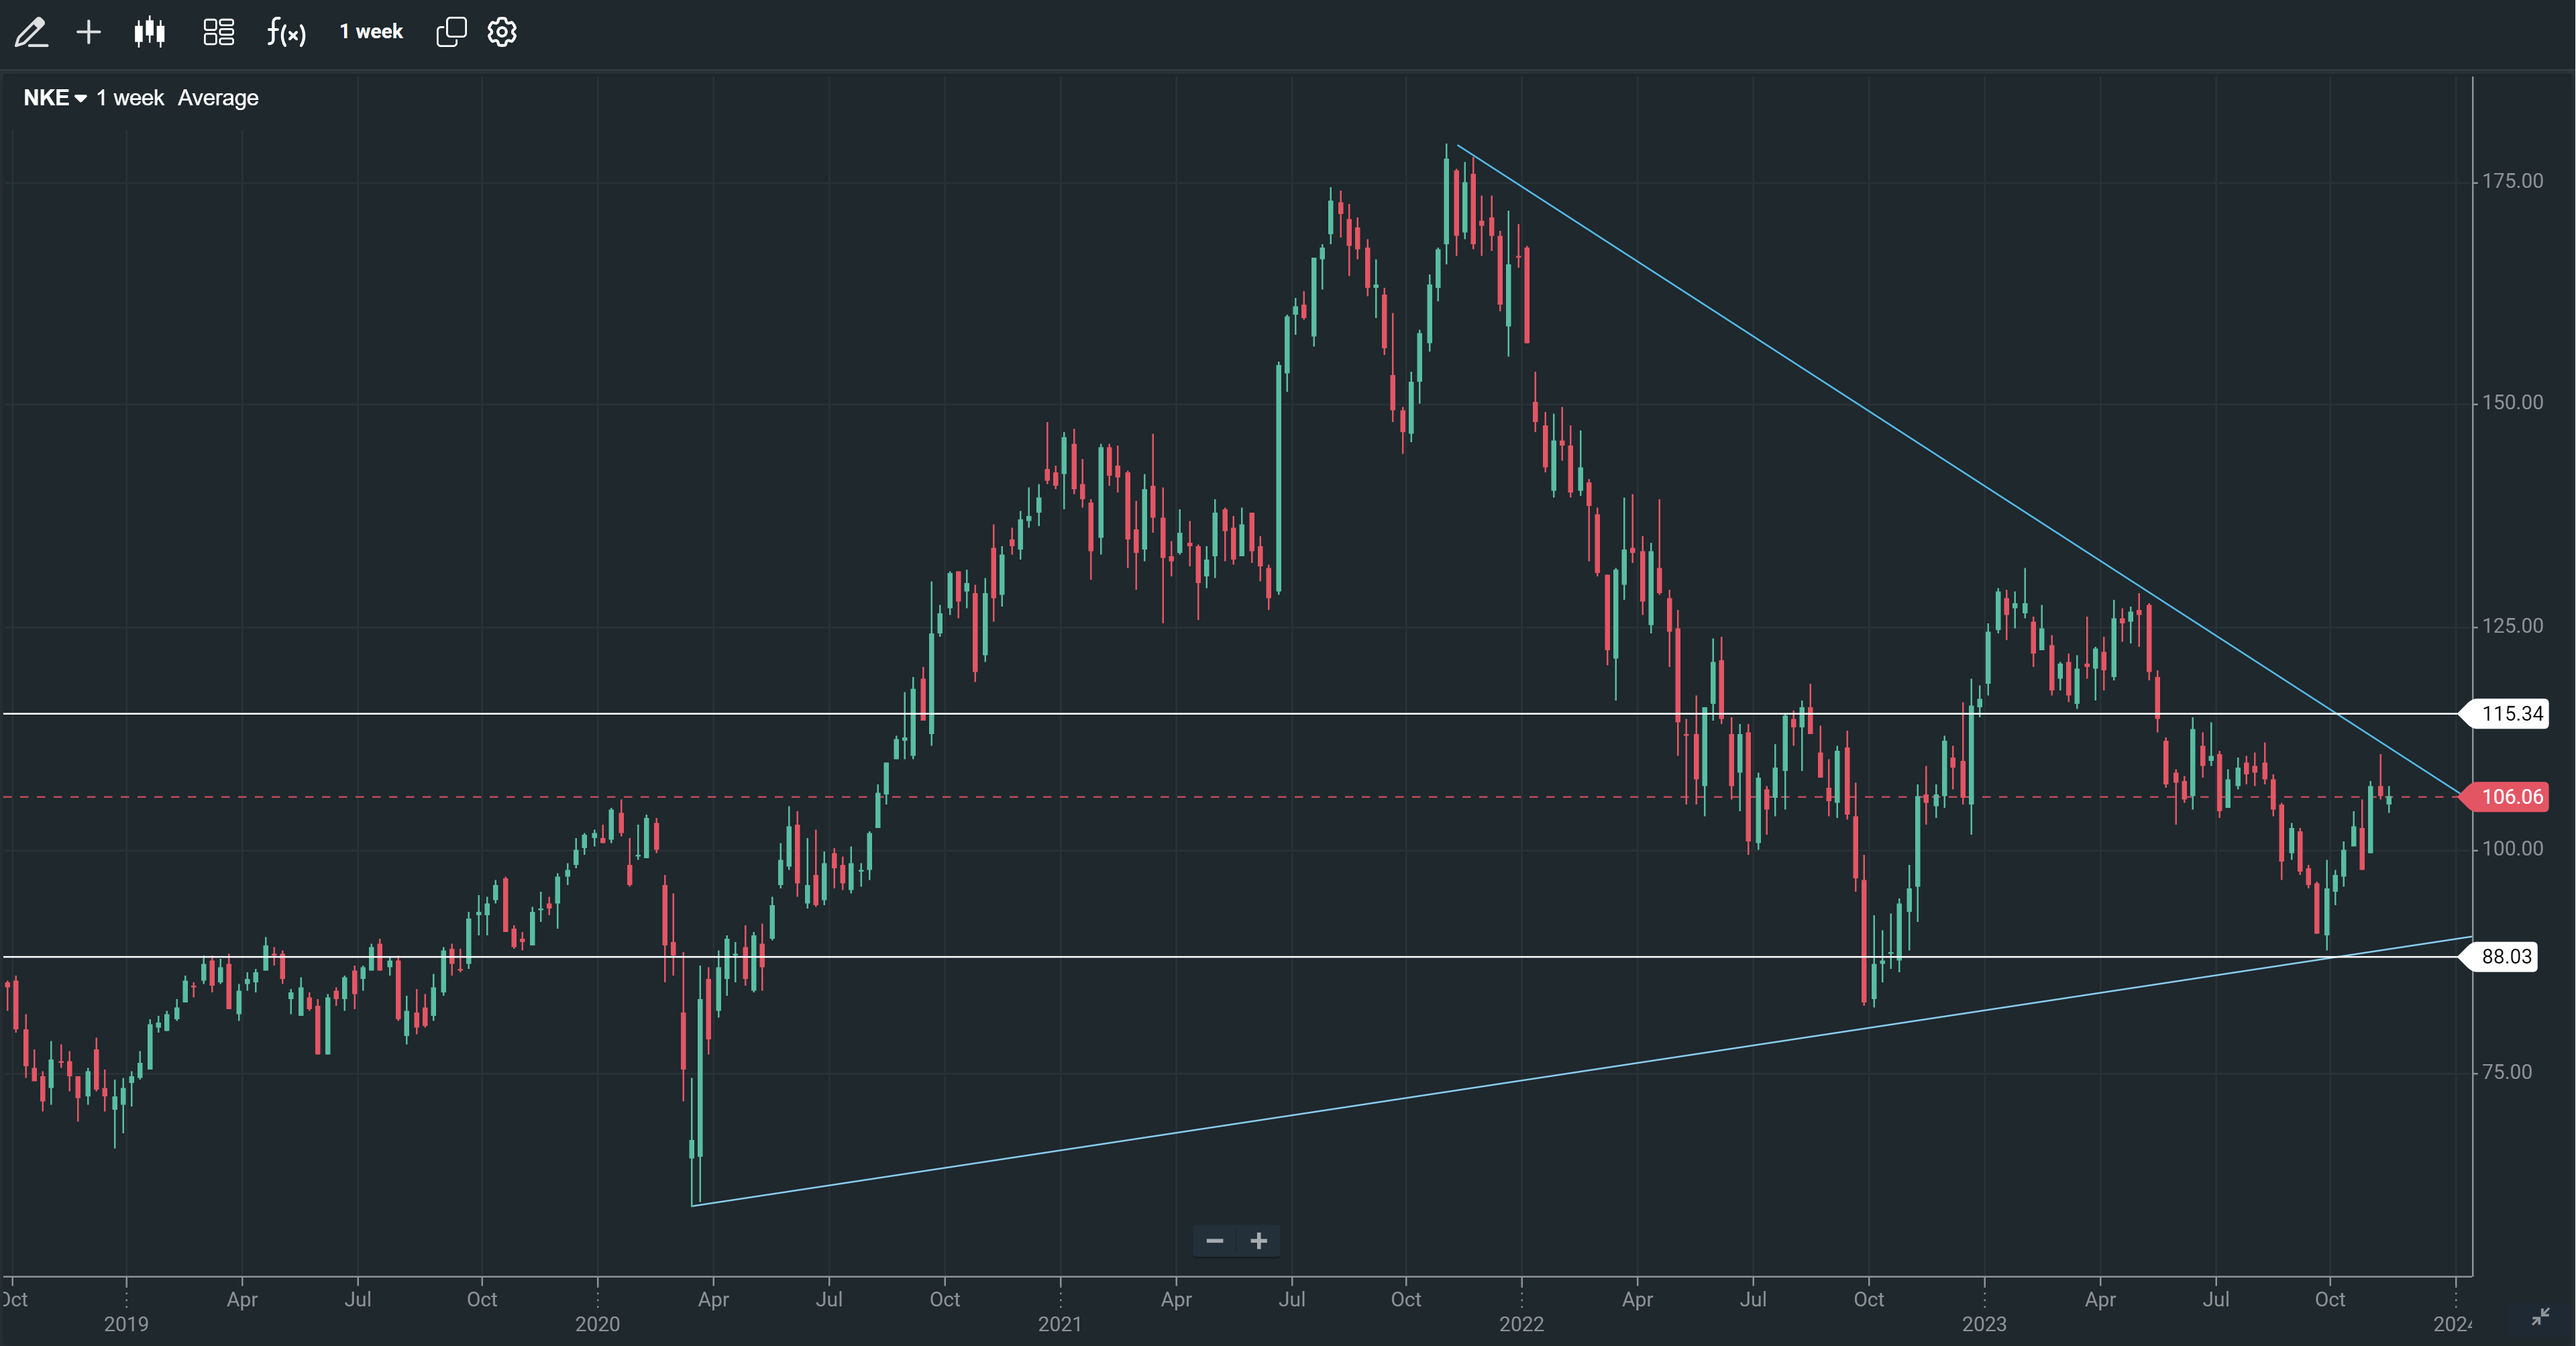
Nike (NKE) Weekly Chart
Any opinions, news, research, analyses, prices or other information contained on this website is provided as general market commentary and does not constitute investment advice. ThinkMarkets will not accept liability for any loss or damage including, without limitation, to any loss of profit which may arise directly or indirectly from use of or reliance on such information.