29 August 2022
Massmart (MSM) – Reviewed Interim Results Presentation and Business Update
Consensus Recommendation BUY

| Highlights |
Actual |
Change |
| Sales |
R38.1 billion |
1.9% |
| EBITDA |
R1.6 billion |
-24% |
| HEPS |
(435.3) cents |
-45.7% |
| DPS |
nil |
|
| Valuation |
Price to Earnings |
Dividend
Yield |
| Massmart |
-8.5x |
- |
| FTSE/JSE Retailers |
30.3x |
3.7% |
Massmart reported a decrease in trading profits and pedestrian growth in sales for the interim period ended 30 June 2022. Group sales increased by 1.9%, while comparable sales increased by 4.3%. Food sales increased by 2.8%, liquor sales increased by 18.1%, and General Merchandise and DIY sales increased moderately by 3.5% as consumers shifted more spending away from discretionary goods. Sales for the Group’s South African operations which constitute 90.6% of total Group sales increased by 1.9%, and by 4.6% on a comparable stores basis. Sales for their Rest of Africa operations, 9.4% of total sales, increased by 1.6%. The Group delivered a bigger loss for the period of R847 million (H12021: -R774.1). Massmart also announced the intention of its majority shareholder, Walmart, to buy out minority shareholders and delist the company from the JSE.
Advtech (ADH) Interim results for the six months ended 30 June 2022 and announcement of dividend declaration
Consensus Recommendation N/A
| Highlights |
Actual |
Change |
| Revenue |
R3.4 billion |
18% |
| Operating Profit |
R612 million |
19% |
| EPS |
68.2 cents |
19% |
| DPS |
23 cents |
- |
| Valuation |
Price to Earnings |
Dividend
Yield |
| Advtech |
12.4x |
3.2% |
| Curro |
21.9x |
0.8% |
Advtech delivered strong half-year results driven by solid enrolment growth in their schools and tertiaries. Revenue growth of 18% was also supported by improved business operations in their resourcing division. Revenue and operating profit in its schools in South Africa and the Rest of Africa increased by 14% and 16% respectively to R1.2 billion and R235 million. Revenue and operating profit in its Tertiary/University division increased by 9% and 13% respectively to R1.3 billion and R315 million. Revenue and operating profit in the Rest of Africa school division increased by 27% and 70% respectively to R153 million and R28 million. All three divisions delivered higher operating profit margins ranging from 18%-24%. The Group’s resourcing division delivered revenue and operating growth of 65% and 136% respectively to R536 million and R29 million. Advtech operates 108 schools and 32 higher-education campuses, with brands including Crawford International, Varsity College and Rosebank College. The resourcing division includes brands including Network Recruitment and CA Global.
25 August 2022
Sun International (SUI) - Unaudited interim group consolidated results and dividend declaration
for the six-months ended 30 June 2022
Consensus Recommendation N/A
| Highlights |
Actual |
Change |
| Income |
R5.2 billion |
37% |
| HEPS |
93 cents |
>100% |
| DPS |
88 cents |
- |
| Valuation |
Price to Earnings |
Dividend
Yield |
| Sun International |
13.7x |
2.8% |
| FTSE/JSE Travel & Leisure |
22.0x |
0.7% |
Sun International delivered a strong recovery in revenue and profits as covid-19 related restrictions eased, allowing the Group to declare its first dividend since 2016. Casino, Sun Slots and Sun Bets (82% of Group income) delivered strong income growth of 30%. Income and adjusted EBITDA for their casino business increased by 35% and 70% respectively to R3.1 billion and R1.1 billion and grew market share in most provinces. Income and adjusted EBITDA for Sun Slots increased by 18% and 17% respectively to R717 million and R178 million. Income and adjusted EBITDA for SunBet increased by 37% and 8% respectively to R125 million and R14 million. The Groups Resorts and Hotels business also recovered quite strongly from the covid-19-related slump, income and adjusted EBITDA increased by 63% and more than 100% respectively to R1.12 billion and R152 million, as revenue from domestic leisure, conferencing and sports and events exceeded 2019 levels.
30 August 2022
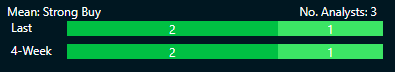
Old Mutual (OMU) - Unaudited interim results for the six months ended 30 June 2022
Consensus Recommendation STRONG BUY
| Highlights |
Actual |
Change |
| Headline earnings |
R5.1 billion |
63% |
| Adjusted headline earnings |
R2.7 billion |
-7% |
| HEPS |
116.3 cents |
62% |
| DPS |
25 cents |
0% |
| Valuation |
Price to Earnings |
Dividend
Yield |
| Old Mutual |
5.1x |
7.2% |
| FTSE/JSE Life Insurance |
10.5x |
4.3% |
Old Mutual reported a strong set of half-year results for the period ended 30 June 2022. Results from operations increased by an impressive 87% to R4.1 billion, driven by strong performances in their Mass and Foundation cluster, the Personal Finance and Wealth Management and the Old Mutual Corporate divisions. Value of new business (VNB) for the Group contracted marginally by 4% to R708 million, as VNB from the Personal Finance and Wealth Management division contracted by more than 80%. The Group’s VNB margin contracted by 10 bps to 2.2% but remains within the 2%-3% target. The Group’s assets under management contracted by 8% to R745.3 billion due to a combination of lower inflows and a decline in markets.
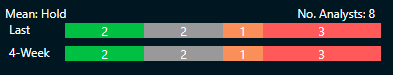
Harmony Gold (HAR) - Results for the year ended 30 June 2022
Consensus Recommendation HOLD
| Highlights |
Actual |
Change |
| Revenue |
R42.6 billion |
2% |
| HEPS |
499 cents |
-49% |
| DPS |
22 cents |
|
| Valuation |
Price to Earnings |
Dividend
Yield |
| Harmony Gold |
8.4x |
1.5% |
| FTSE/JSE Precious Metals & Mining |
7.8x |
6.3% |
Harmony gold production for the year decreased by 3% to 46 236kg (1 486 517oz) from 47 755kg (1 535 352oz) mainly as a result of safety-related stoppages, mining constraints and supply chain disruptions at its operations in South Africa. Group capital expenditure increased by 21% to R6.2 billion from R51 billion in the prior financial period but was R1.8 billion below what had been planned. The Group reported a net gain on derivatives (including realised and unrealised) of R53 million compared to a net gain of R1.022 billion (US$66 million) in FY2021. Harmony’s financial performance in FY22 reflects a net loss of R1.012 billion compared to a net profit of R5.124 billion (US$326 million) in FY2021. Basic earnings per share declined more than 100% from 842 cents per share (54 US cents) in FY2021 to a loss of 172 cents per share (8 US cents).
31 August 2022
Motus (MTH) - Short-form preliminary summarised audited consolidated results for the year ended 30 June 2022 and cash dividend
Consensus Recommendation STRONG BUY

| Highlights |
Actual |
Change |
| Revenue |
R91.9 billion |
5% |
| Operating profit |
R5.02 billion |
31% |
| HEPS |
2 025 cents |
27% |
| DPS |
710 cents |
71% |
| Valuation |
Price to Earnings |
Dividend
Yield |
| Motus |
6.5x |
5.4% |
| FTSE/JSE Retailers |
30.3x |
3.7% |
Motus sales of new vehicles increased by 9% to R44 billion, sales of used vehicles contracted slightly by 4% to R21.3 billion, sales of parts increased by 8% and lastly rendering of services increased by 10% to R9.6 billion. The passenger and commercial vehicle businesses sold 119,933 new units, a 13% rise, as consumers bought down. The strong operating profit growth of 31% was driven by the recovery of the auto and car rental sectors, increased margins due to inventory shortages, increased volumes, acquisitions in SA, and the return to profitability of the Group’s joint venture in the Mobility Solutions segment. Supply disruptions and increases in freight and logistics costs did offset some of the growth in operating profits, however. The business is cash-flush, giving it a lot of flexibility and room for acquisitions, with one big acquisition overseas already underway. The dividend declared of 710 cents is the highest since the company was listed on the JSE in November 2018.
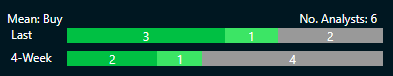
Woolworths (WHL) - Summary of the audited group results for the 52 weeks ended 26 June 2022 and cash dividend declaration
Consensus Recommendation BUY
| Highlights |
Actual |
Change |
| Turnover |
R80.1 billion |
1.7% |
| Turnover & concession sales |
R87.0 billion |
1.4% |
| HEPS |
398.9 cents |
6.5% |
| DPS |
229.5 cents |
247.7% |
| Valuation |
Price to Earnings |
Dividend
Yield |
| Woolworths |
15.4x |
3.7% |
| FTSE/JSE Retailers |
30.3x |
3.7% |
Woolworths reported a strong set of annual results, reflecting strong performances in its fashion and clothing business, a stronger balance sheet and recovering Australian operations. Woolworths Fashion, Beauty and Home (FBH) sales and earnings before interest and taxes (EBIT) increased by 5% and 49% respectively to R13.5 billion and R1.6 billion. Comparable store sales increased by an impressive 7.3% with a price inflation of 6%. This is after the Group repositioned its clothing away from more ladies formal wear to more ladies basics which seems to be resonating more with consumers. The FBH gross profit margin improved to 47.6% from 45.5% due to lower markdowns. Woolworths Food sales and EBIT increased by 4.2% and -3.9% respectively to R39.8 billion and R2.9 billion. Comparable food store sales increased by 3.1%, while gross profit and EBIT margins both contracted from 24.5% to 24% and 7.9% to 7.3% respectively. Sales and EBIT for David Jones contracted slightly by 2.6% and 0.6% respectively to A$2.06 billion and A$84 million, while sales and EBIT for Country Road increased by 3.1% and -22.3% respectively to A$1.05 billion and A$155 million. The Group is in a stronger balance sheet position and has reduced debt by R12 billion in two years.
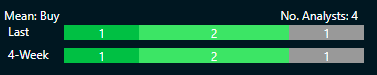
Aspen (APN) - Reviewed Provisional Group Financial Results for the year ended 30 June 2022 and Dividend Declaration
Consensus Recommendation BUY
| Highlights |
Actual |
Change |
| Revenue |
R38.6 billion |
2% |
| Normalised EBITDA |
R11 billion |
11% |
| Normalised HEPS |
1 628 cents |
24% |
| DPS |
326 cents |
24% |
| Valuation |
Price to Earnings |
Dividend
Yield |
| Aspen |
10x |
2.2% |
| Adcock Ingram |
9.9x |
4.3% |
Aspen Commercial Pharmaceuticals (72% of total revenue) and Manufacturing (28%) revenue increased by -1% and 11% respectively during the period under review. Regional Brands and Sterile Focus Brands which fall under the Commercial Pharmaceuticals segment experienced a mixed set of economic conditions. Sales and gross profit margin for Regional Brands increased by 3% to R17.4 billion and by 1.9 percentage points to 56.5% respectively, while sales and gross profit margins for the Sterile Focus Brands decreased by 2% to R10.3 billion and increased by 0.7 percentage points to 60.7%. Manufacturing revenue increased to R10.9 billion and gross profit margin remained consistent at 20.6%. On a currency-neutral basis, group revenue increased by 5%. The Group is in a stronger net debt position with a lower leverage ratio of 1.9x (FY2021: 2.1x, FY2020: 3.2x).
Any opinions, news, research, analyses, prices or other information contained on this website is provided as general market commentary and does not constitute investment advice. ThinkMarkets will not accept liability for any loss or damage including, without limitation, to any loss of profit which may arise directly or indirectly from use of or reliance on such information.

Learn and earn more today.
Visit our Education Centre