In this article, we will try to provide an outlook for the week ahead, this outlook may help to identify how markets may move and how we may deal with different scenarios by providing the most important news and simple technical analysis for major financial assets.
Disclaimer and warning
All information provided in this report is based on public information and it may be canceled or updated at any time based on changes in prices and economic events.
Any opinions, news, research, analyses, prices or other information contained on this document is provided as general market commentary and does not constitute investment advice. ThinkMarkets will not accept liability for any loss or damage including, without limitation, to any loss of profit which may arise directly or indirectly from use of or reliance on such information.
Any decision that has been taken based on information in this report is your sole responsibility without any liability on ThinkMarkets.
Derivative products are leveraged products and can result in losses that exceed initial deposits. Please ensure you fully understand the risks and take care to manage your exposure and seek independent advice if necessary.
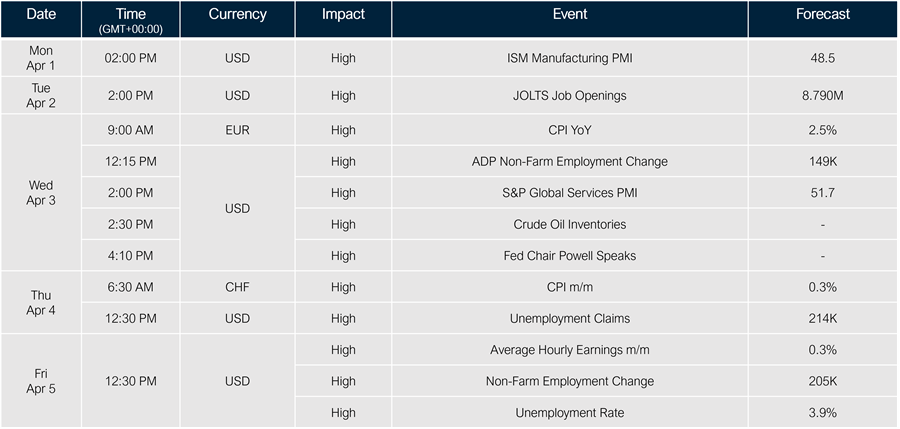
Hot news for the week
USD index
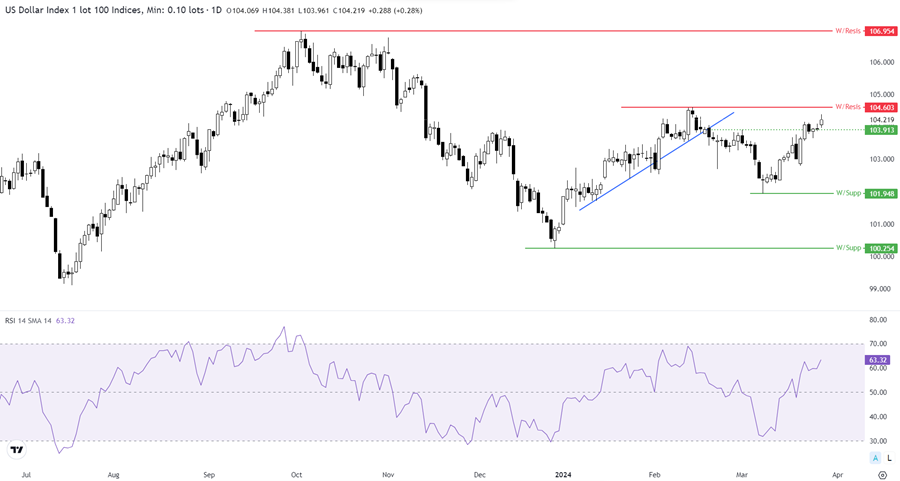
Looking at the price action on the daily chart of the US index, after correction below 104.155, prices rebounded to rise above this level and it may test the resistance level of 104.600.
Short-term view: It might be better to wait until breaking above 104.600 to buy.
EURUSD
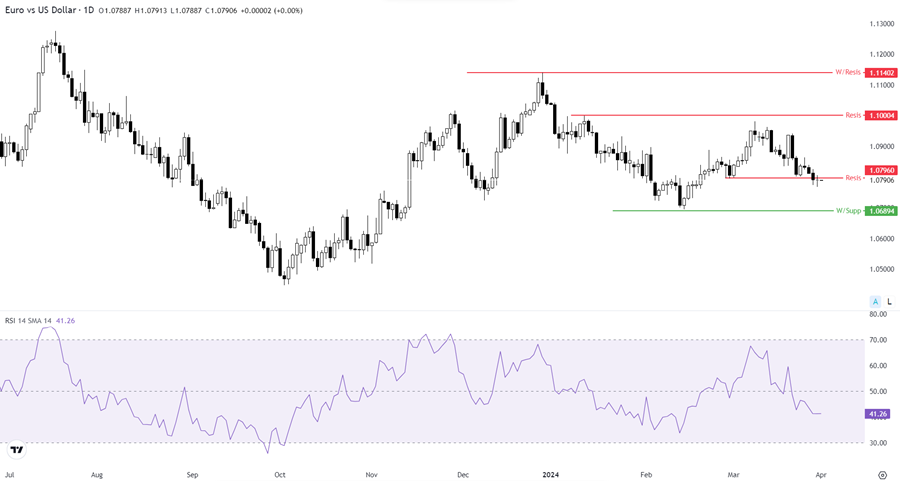
As we can see on the daily chart of the EURUSD, Prices broke below 1.07904 which indicates a strength of sellers.
Short-term view: If prices continue trading below 1.07904, it might be a sell signal because prices may decline to test the support of 1.06894.
USDJPY
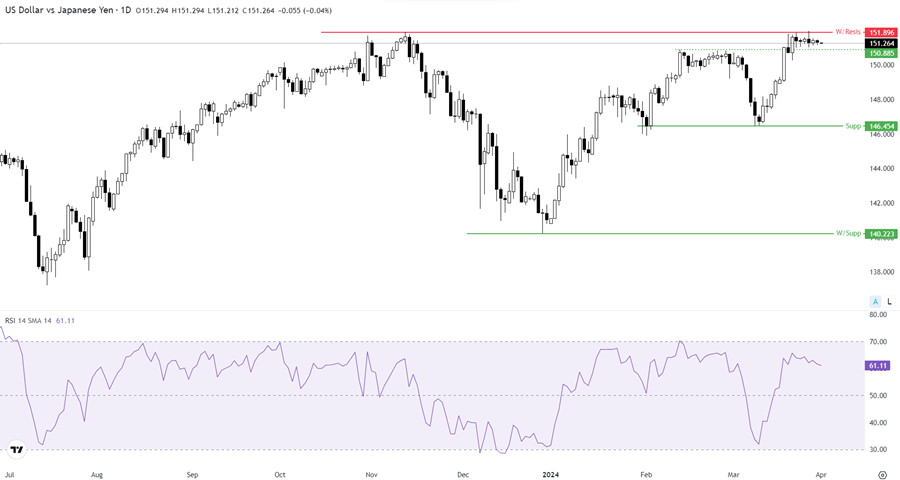
As we can see on the daily chart of the USDJPY, there is still sideways between 151.90 and 146.45. Buyers are still testing the level of 151.90 without breaking it to above.
Short-term view: If prices break and continue to trade above 151.90, it may be better to focus on buying positions.
GBPUSD
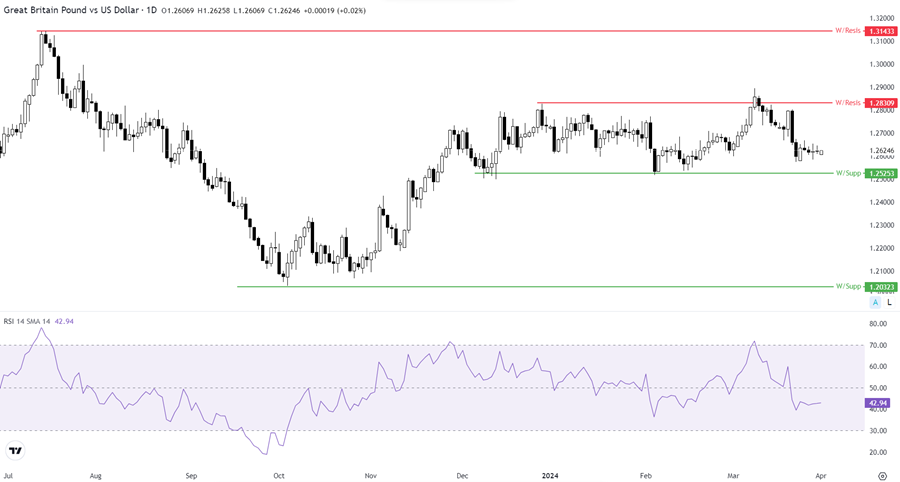
As we can see on the daily chart of the GBPUSD, the same view of the previous week is still applied because the pair continues to trade sideways between 1.28310 and 1.25253.
Short-term view: It may be better to take trades between these sideways levels of 1.28310 and 1.25253 with high risk and trade management in mind or wait for a clear trend above 1.28310 to buy or below 1.25253 to sell.
USDCHF
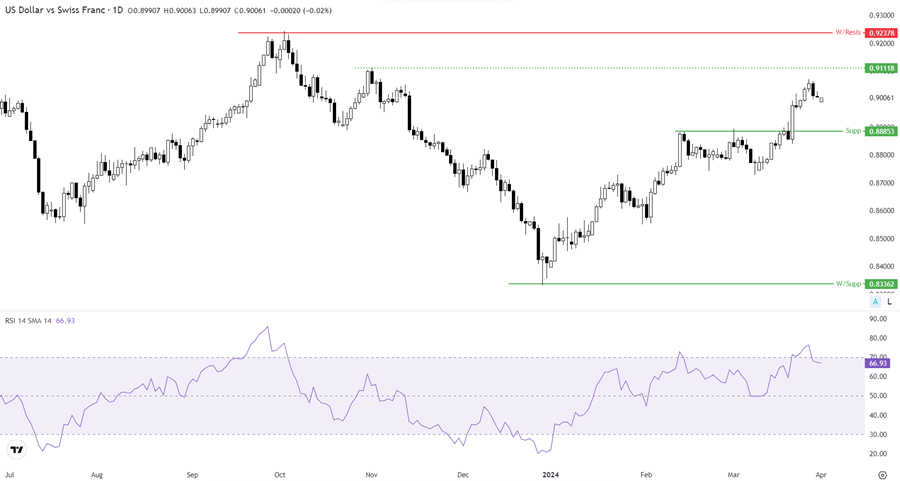
As we can see on the daily chart of the USDCHF, We found a rise movement toward 0.90711, and then the correction happened below this level which might be a profit-taken.
Short-term view: if it continues to trade above 0.88853, it might be better to focus on buying positions.
XAUUSD
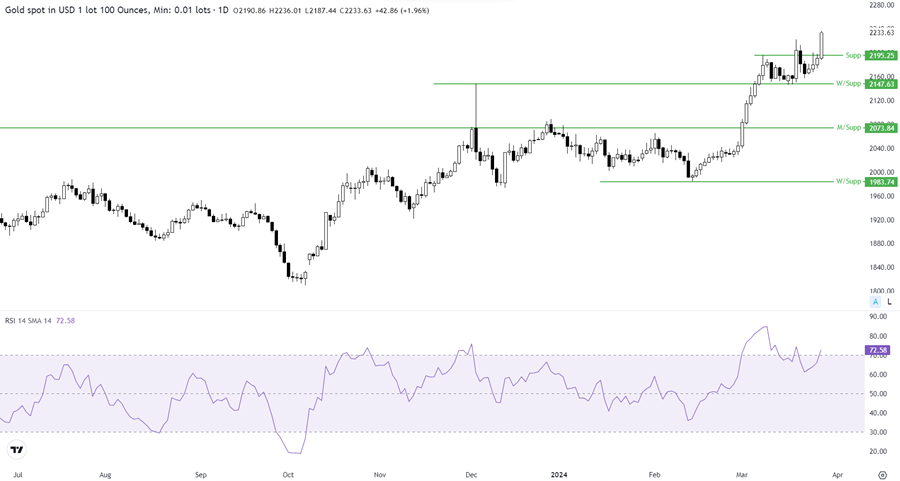
As we can see on the daily chart of Gold, After a sideways movement between 2196 and 2148, it went up to record a new high and closed at 2236 which confirms the uptrend and the strength of buyers.
Short-term view: It might be better to focus on buying positions if prices keep trading above the level of 2222.
Brent
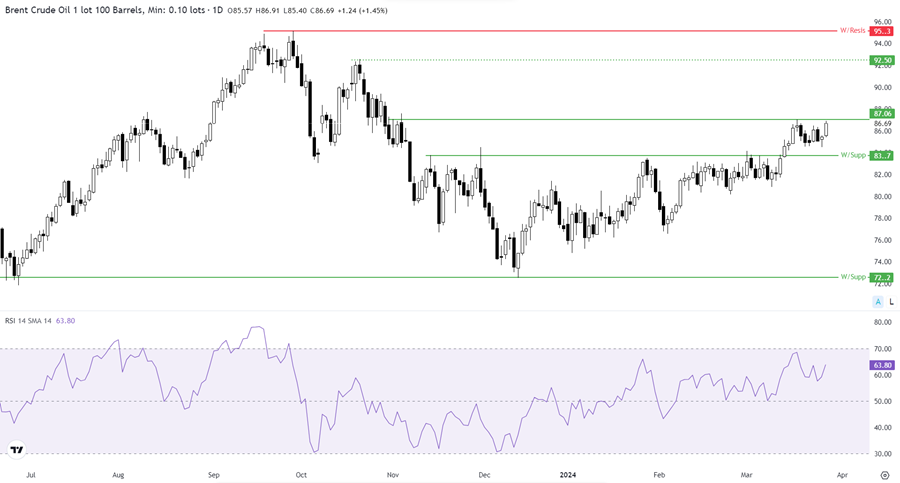
As we can see on the daily chart Brent, after the correction below the 87.06 prices rebounded above the level of 83.7 to test the level of 87.06. So, we may consider that we have a sideways movement between these two levels.
Short-term view: It might be better to focus on buying positions if prices break and keep trading above the level of 87.06.
US30

As we can see on the daily chart of the US30, after the correction prices tested the 39303 support level from above and rebounded to rise around the resistance level of 39952.
Short-term view: It might be better to focus on buying positions if prices break and continue to trade above the 39952.
NAS100
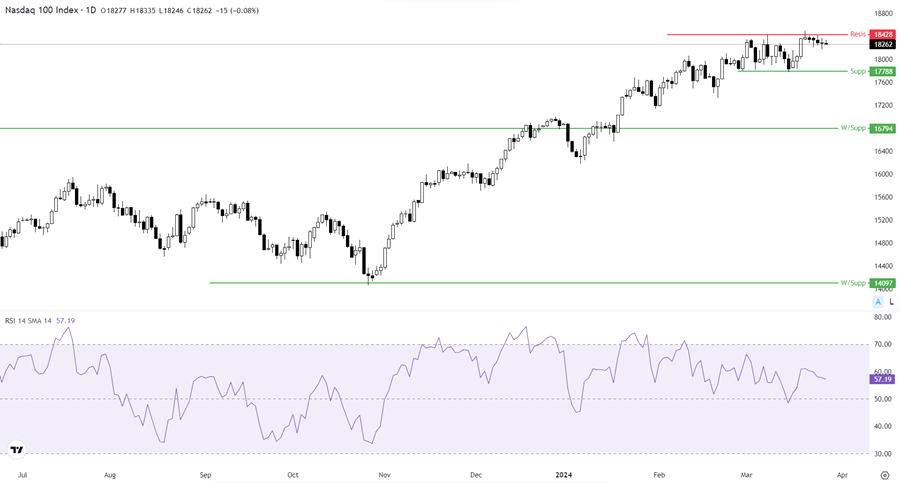
As we can see on the daily chart of the NAS100, the same view of the previous week is still applied. There is a resistance against buyers around the level of 18428.
Short-term view: It may be better to focus on buying positions when prices are above 18425 and continue to trade above it.
S&P 500
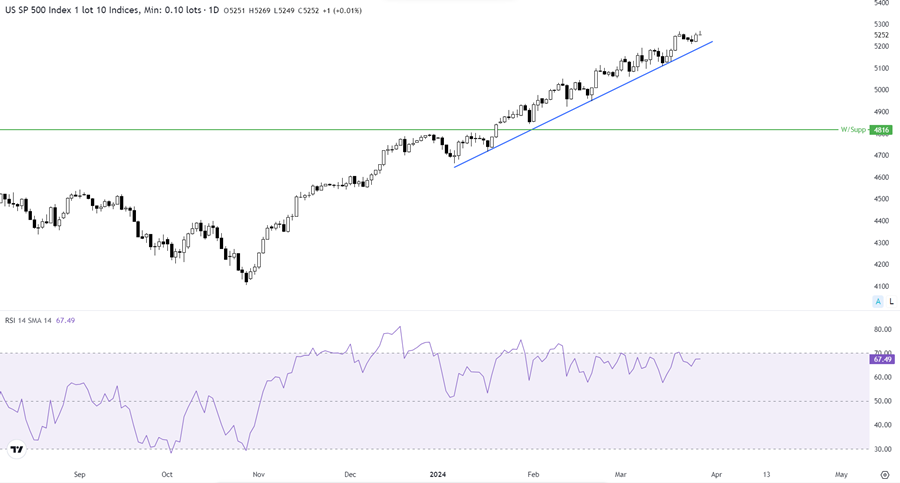
As we can see on the daily chart of the S&P 500, we have an uptrend and it continues recording new highs since breaking above the 4816.
Short-term view: It may be better to focus on buying positions if prices keep trading above 4816.
UK100
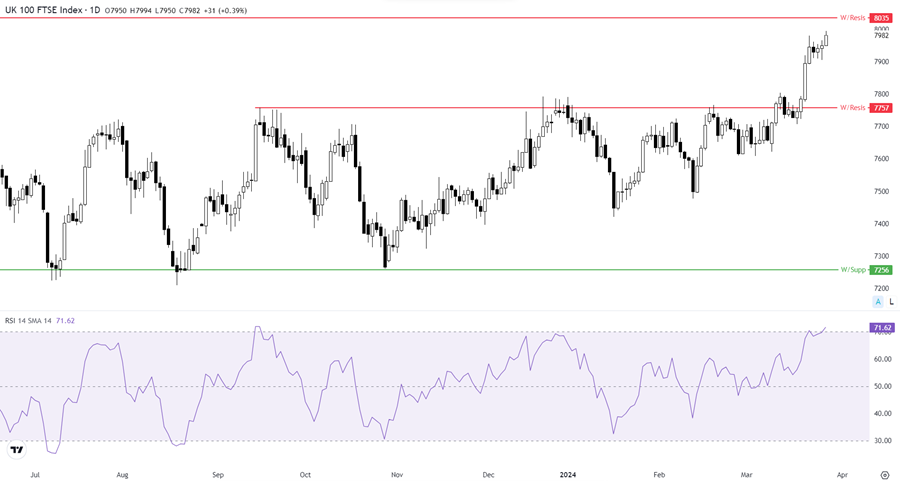
As we can see on the daily chart of the UK100, buyers are still in the game keeping prices to rise toward the resistance level around 8035.
Short-term view: It might be better to buy when prices break and keep trading above 8035 or around 7757 if there is a correction.
BTCUSD
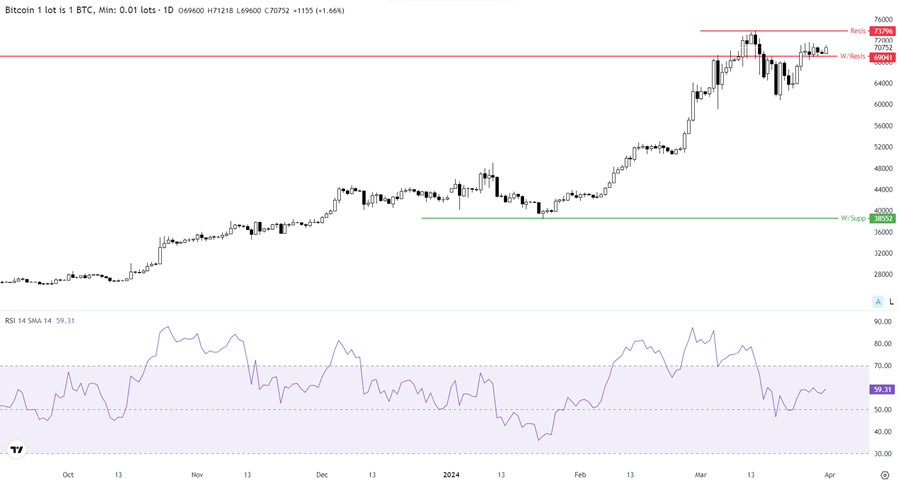
As we can see on the daily chart of the BTCUSD, prices moved above 69041 and kept trading above it.
Short-term view: It may be better to focus on buying positions around 69041 or 73796 when breaking and keeping to trade above it.
ETHUSD
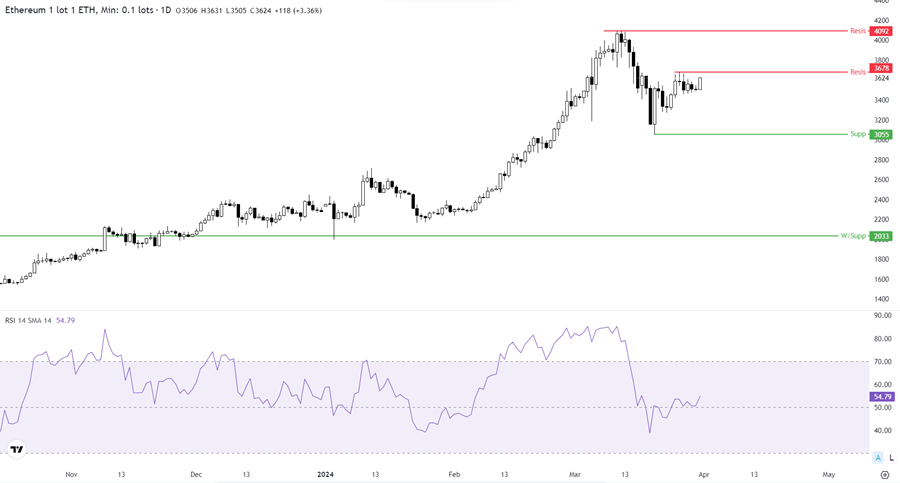
As we can see on the daily chart of ETHUSD, there was a sideways below the 3678 level and above the 3055 which indicates a kind of balance between buyers and sellers.
Short-term view: It might be better to focus on buying positions if prices break and keep trading above 3678 and continue to trade above it.
Any opinions, news, research, analyses, prices or other information contained on this website is provided as general market commentary and does not constitute investment advice. ThinkMarkets will not accept liability for any loss or damage including, without limitation, to any loss of profit which may arise directly or indirectly from use of or reliance on such information.