In today's ThinkTechnical, we review 10 charts of the most popular cryptocurrencies. We'll keep it to the point and give you a BUY+BTD/HOLD/SELL tip at the end of each. In just 10 minutes you'll be across all of the big technical analysis moves in crypto!
Highlights
- Bitcoin vs $US (BTCUSD)
- Cardano vs $US (ADAUSD)
- Chainlink vs $US (LINKUSD)
- Dogecoin vs $US (DOGEUSD)
- Ethereum vs $US (ETHUSD)
- Polkadot vs $US (DOTUSD)
- Polygon (MATIC) vs $US (MATICUSD)
- Ripple vs $US (XRPUSD)
- Shiba Inu vs $US (SHIBUSD)
- Solana vs $US (SOLUSD)
Bitcoin vs $US (BTCUSD) - SELL
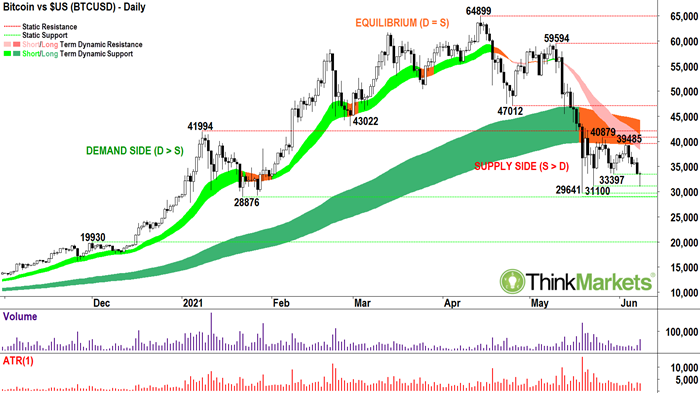
- ST/LT Trends: Down/Down
- Remains stuck in supply side market
- Resisted by dynamic long term trend zone, and by static resistance at 40879-41994
- Support at 28876-31100, appears to be holding for now
- Constructive last candle is backed up with elevated volume, indicates accumulation
- Bias still down, with potential target towards 20,000 if 28876 breaks.
Cardano vs $US (ADAUSD) - HOLD
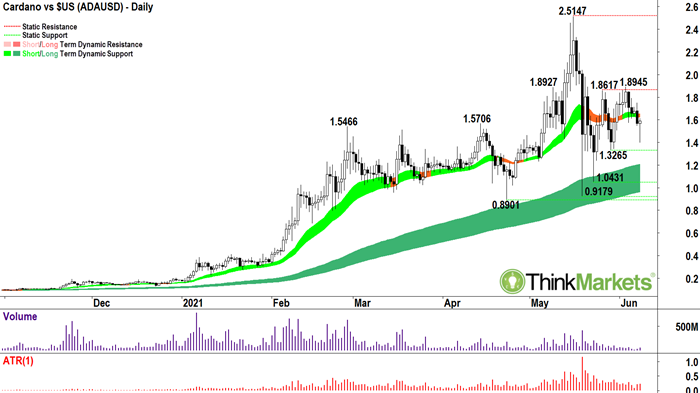
- ST/LT Trends: Neutral/Up
- Remains supported on dips and is trending toward top of recent consolidation range
- Resistance at 1.8945
- Support at 1.3265
- Solid candle last candle, but lacked conviction via a strong volume performance
- Appears to be best of majors from a technical standpoint
- Bias #HODL whilst remains above 1.0431, and watching for a break of 1.8945 to resume the long term uptrend
Chainlink vs $US (LINKUSD) - SELL
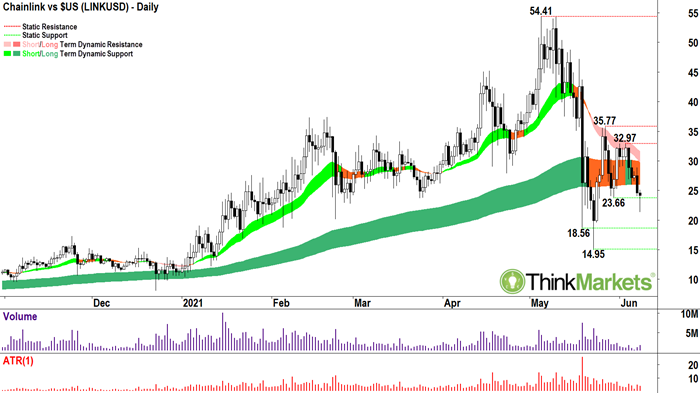
- ST/LT Trends: Neutral/Down
- Compressing in a range around the long term dynamic support zone
- Break of 23.66 puts back in bearish short term price action (lower peaks, lower troughs)
- Constructive last candle but lacks conviction from volume
- Resistance at 32.97-35.77
- Support at 23.66?, then 18.65 and 14.95
- Bias is avoid/sell due to deteriorating technical picture
Dogecoin vs $US (DOGEUSD) - HOLD
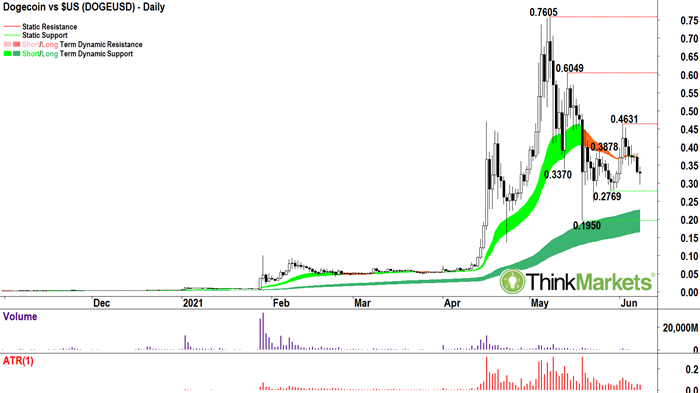
- ST/LT Trends: Down/Up
- Remains in short term price action uptrend (higher peaks, higher troughs)
- Candles since 0.4631 peak demonstrate solid and sustained supply
- Last candle but lacks conviction from volume (which looks like has completely dried up = diminished interest)
- A quick move back above 0.3828 (bear candle on 7 June) required to arrest recent poor form
- Resistance at 0.4631, now looks like major pivot level
- Support at 0.2769, then 0.1950
- Bias is avoid/hold due to deteriorating technical picture
Ethereum vs $US (ETHUSD) - HOLD
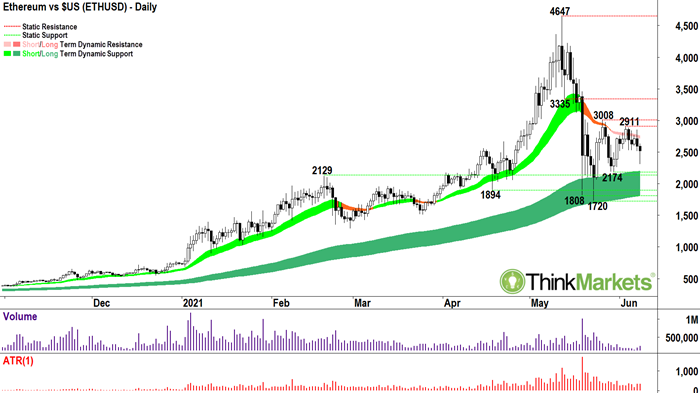
- ST/LT Trends: Down/Up
- Continues to compress within an equilibrium zone between 1720 and 3008
- Appears to lack conviction to upside, but remains well supported on dips
- Resistance at 3008
- Support between 1720-2174, appears holding for now
- Bias is hold whilst remains above 2174, and watching for a break of 3008 to resume the long term uptrend
Polkadot vs $US (DOTUSD) - HOLD
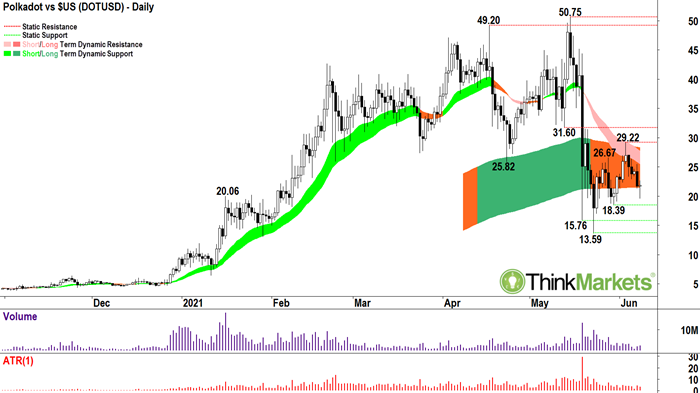
- ST/LT Trends: Neutral/Neutral
- Compressing in a range around the long term dynamic support zone
- EMA's indicate short term downtrend, but note price action shows short term uptrend (higher peaks, higher troughs). Price action tends to lead, so constructive for recovery
- Last candle also constructive for short term bounce, there is some conviction in volume (but would prefer more to be convinced this is a potential rally point)
- A quick move back above 25.52 (bear candle on 7 June) required for confident resumption of price action uptrend
- Resistance at 29.22, then 31.60
- Support at 18.39, then 15.76
- Bias is hold whilst 18.39 holds due to price action uptrend
Polygon (MATIC) vs $US (MATICUSD) - HOLD
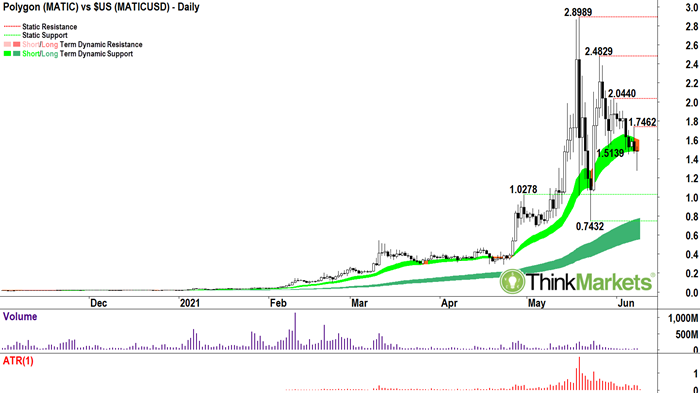
- ST/LT Trends: Neutral/Up
- Relatively strong compared to others, but looks coming under increasing pressure
- Price action downtrend is concern, as is distance to key support points
- Last candle constructive for short term bounce, but lacks conviction in volume
- Risks drift lower unless can break back above 1.7462, preferably with volume spike
- Resistance at 1.7462, then 2.0440
- Support at 1.0278
- Bias is hold on the basis of sound relative performance
Ripple vs $US (XRPUSD) - HOLD
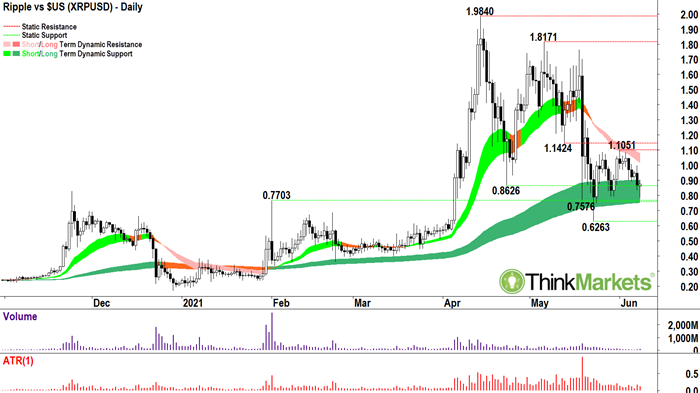
- ST/LT Trends: Down/Up
- Compressing in a range above the long term dynamic support zone, supportive of maintaining long term trend
- Price action shows short term uptrend, but with significant overlap of peaks and troughs (lower quality)
- Resistance at 1.1051
- Support at 0.7703 then 0.7576
- Bias is hold whilst trading above long term uptrend
Shiba Inu vs $US (SHIBUSD) - SELL
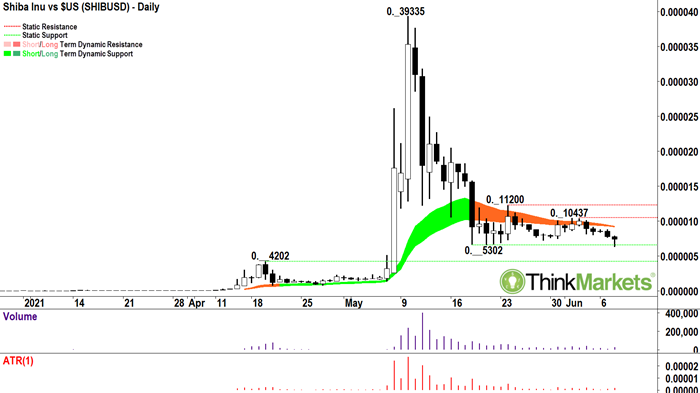
- ST/LT Trends: Down/N/a
- Dodged a bullet on last candle as did not close below key support, but still looks under massive pressure until breaks back above 0._10437-0._11200
- Bear case most likely with a close below 0.__5302 to trigger move to 0.__4202
- Bias is avoid/sell as prefer to stay out of the memecoins
Solana vs $US (SOLUSD) - BUY/BTD
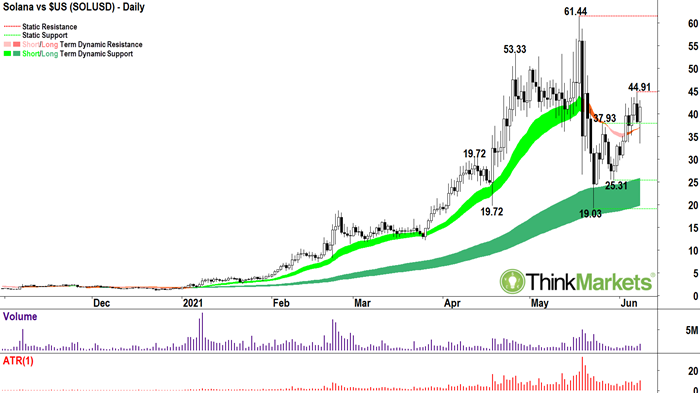
- *Best technicals of Top 20 crypto's*
- ST/LT Trends: Up/Up
- Remains supported on dips with solid candles (particularly last candle relative to other Top 20's) and price action remains higher peaks and troughs
- Resistance at 44.91, then 53.33 and 61.44
- Support at 33.42, then 25.31
- Bias - it's the only one with a buy/buy the dips rating…says it all
Note: Analysis is accurate as of close of candle 8 June 2021. The current candle for 9 June is 'live' and therefore should not be considered by analysts working on an end-of-day basis, as is the case for this post.
Any opinions, news, research, analyses, prices or other information contained on this website is provided as general market commentary and does not constitute investment advice. ThinkMarkets will not accept liability for any loss or damage including, without limitation, to any loss of profit which may arise directly or indirectly from use of or reliance on such information.
Tags:
Technical Analysis

Learn and earn more today.
Visit our Education Center