Here is our weekly market outlook for the week 11- 15 March 2024 where we will
provide a general view on the most important financial assets after mentioning
the most important news.
All information provided in this report is based on public information and it
may be canceled or updated at any time based on changes in prices and economic
events.
Any opinions, news, research, analyses, prices or other information contained
on this document is provided as general market commentary and does not
constitute investment advice. ThinkMarkets will not accept liability for any
loss or damage including, without limitation, to any loss of profit which may
arise directly or indirectly from use of or reliance on such information.
Any decision that has been taken based on information in this report is your
sole responsibility without any liability on ThinkMarkets.
Derivative products are leveraged products and can result in losses that
exceed initial deposits. Please ensure you fully understand the risks and take
care to manage your exposure and seek independent advice if necessary.
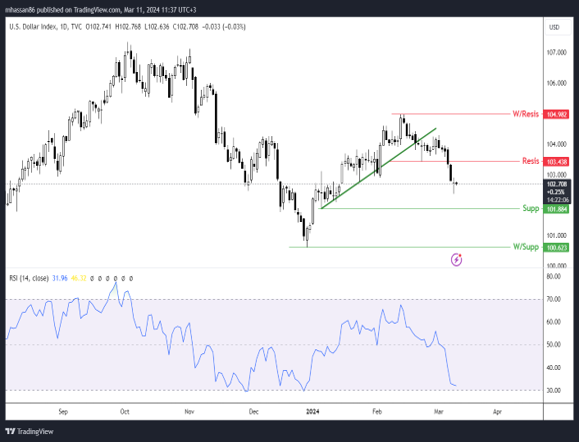
As per price action on the daily chart, we have a down moving after breaking
the level of 103.438. So, it might continue moving down to test the support
level around 101.884 and the weekly support around 100.623 and this might
happen also after slightly up moving to test the level of 103.438 from
below.
short-term view: if prices continue below the level of 103.438, it might be
better to focus on selling positions but if prices break above 103.438 and
continue trading above, it might be better to focus on buy positions.
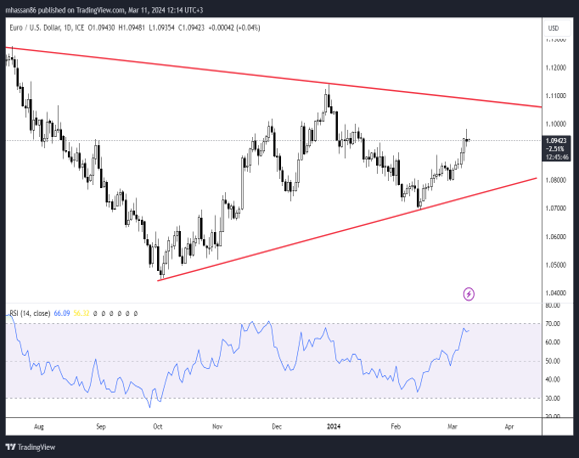
As we can see on the daily chart, there is a sideways move which might refer
to some balance between buyers and sellers and no clear trend.
short-term view: It might be better to wait until we find one party (buyer or
seller) controls.
As we can see on the daily chart, there is a down movement after rebounding
from below 152.024 which is a resistance weekly level which means that it
might continue moving down to test 145.908 and if it breaks this level and
continues moving down it might continue to test lower levels in addition to
that we might find some smaller corrections to up.
short-term view: based on the bearish view it might be better to focus on
selling positions.
As we can see on the daily chart, there is a down moving after testing the
level of 0.88954 from below and rebounded to lower prices which means it might
be a sign of strength of sellers, so, if prices closed and continued to trade
below 0.87428, it might be a sign to see a lower prices around 0.85553.
short-term view: It might be better to focus on selling positions.
.png.aspx)
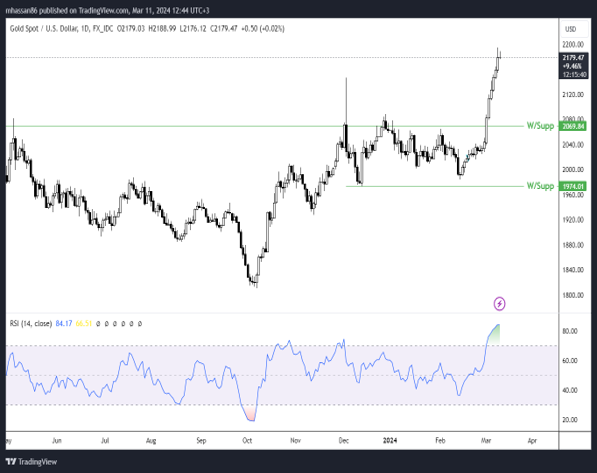
As we can see on the daily chart, there is up moving after breaking above
2069.84 without any correction which means that there might be a strength of
buyers over sellers and it might be some corrections.
short-term view: It might be better to focus on buying positions if prices are
above the level of 2069.84.
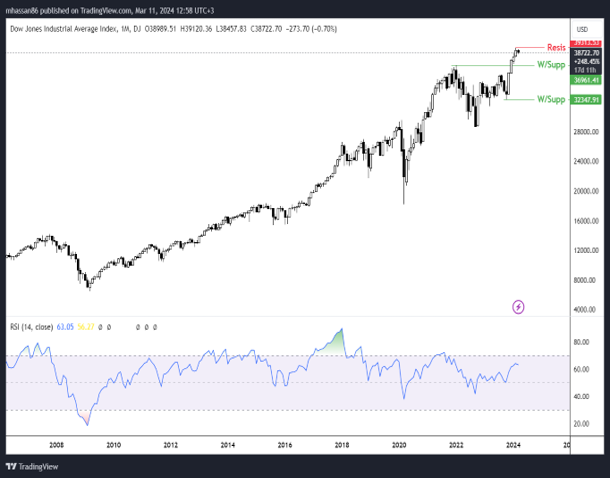
As we can see on the daily chart, there is a sideways movement which might be
considered a correction after the last up movement for some profit-taking.
short-term view: It might be better to focus on buying positions if prices are
above the level of 39313.53.
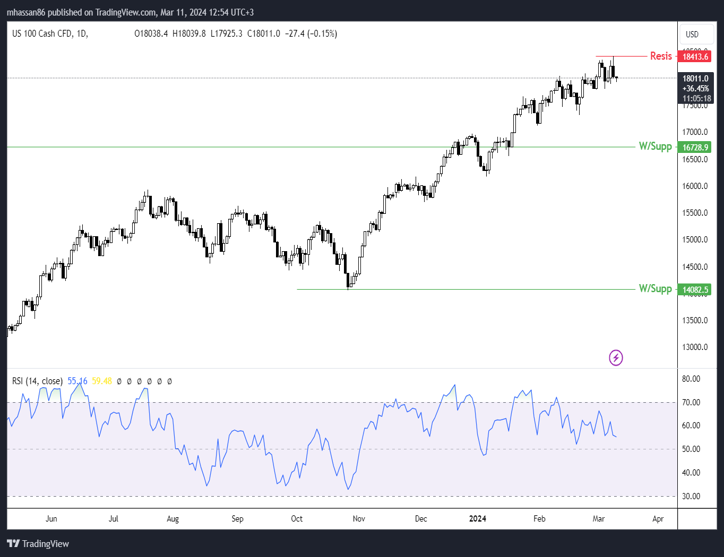
As we can see on the daily chart, there is a sideways movement which might be
considered a correction after the last up movement for some profit-taking.
short-term view: It might be better to focus on buying positions if prices are
above the level of 18413.6.
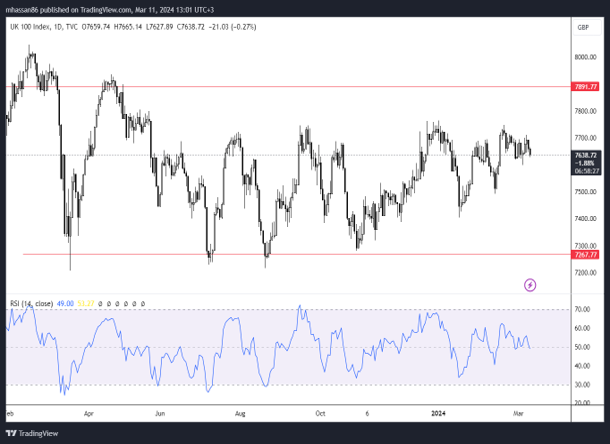
As we can see on the daily chart, there is a sideways movement between 7891.77
and 7267.77 which means that there might be a balance between buyers and
sellers.
short-term view: It might be better to wait to see buyers or sellers control
and see a clear trend.
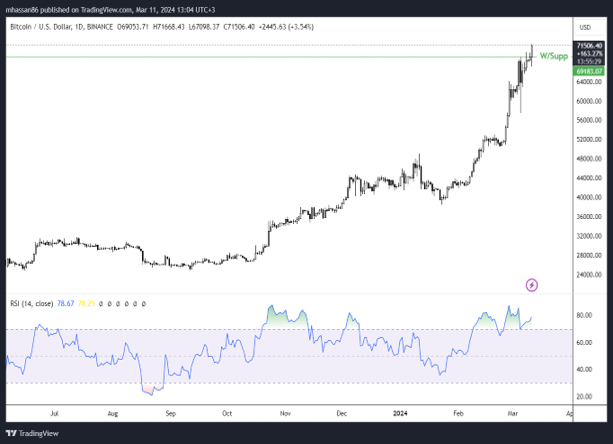
As we can see on the daily chart, there is a new all-time price level recorded
after breaking above 69080.70 which means that there might be a strength of
buyers and prices might continue higher.
short-term view: It might be better to focus on buying positions if prices
continue trading above 69080.70 considering high risk and trade management.
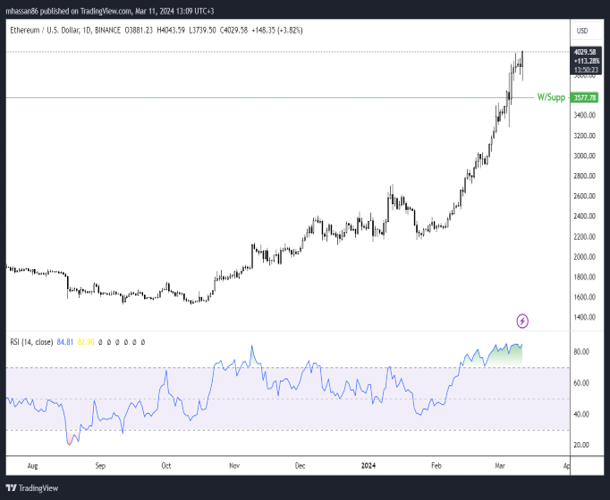
As we can see on the daily chart, there is an up movement after breaking above
3577.78 which means that it might be a sign of strength of buyers.
short-term view: It might be better to focus on buying positions if prices
continue trading above 3577.78 considering high risk and trade management.
Any opinions, news, research, analyses, prices or other information contained on this website is provided as general market commentary and does not constitute investment advice. ThinkMarkets will not accept liability for any loss or damage including, without limitation, to any loss of profit which may arise directly or indirectly from use of or reliance on such information.

Learn and earn more today.
Visit our Education Center