In this article, we will try to present an overview for the week ahead by providing the most important news and a simple technical analysis point of view for major financial assets.
Disclaimer and warning
All information provided in this report is based on public information and it may be canceled or updated at any time based on changes in prices and economic events.
Any opinions, news, research, analyses, prices or other information contained on this document is provided as general market commentary and does not constitute investment advice. ThinkMarkets will not accept liability for any loss or damage including, without limitation, to any loss of profit which may arise directly or indirectly from use of or reliance on such information.
Any decision that has been taken based on information in this report is your sole responsibility without any liability on ThinkMarkets.
Derivative products are leveraged products and can result in losses that exceed initial deposits. Please ensure you fully understand the risks and take care to manage your exposure and seek independent advice if necessary.
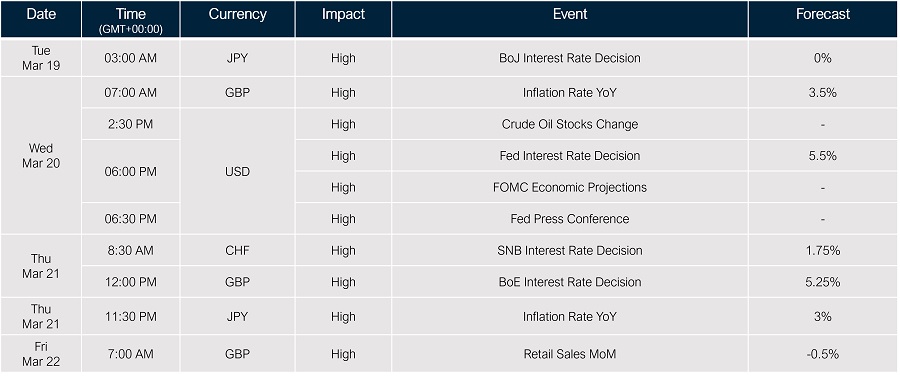
Hot news for the week
USD index
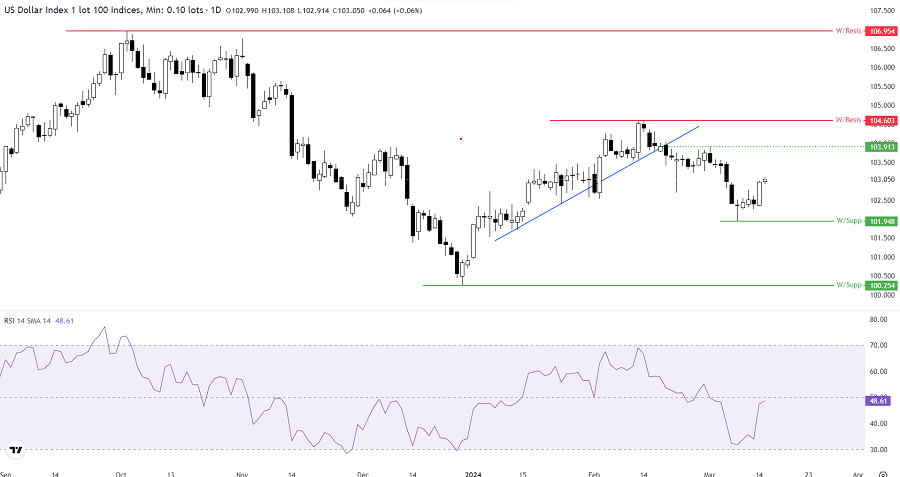
As per price action on the daily chart of the US Index, we have an up movement above 101.948 which might be a correction after the last down movement and it might continue moving up to retest levels of 103.900 and 104.600.
short-term view: if prices continue below the level of 104.600, it might be better to focus on selling positions but if prices break above 104.600 and continue trading above, it might be better to focus on buy positions.
EURUSD
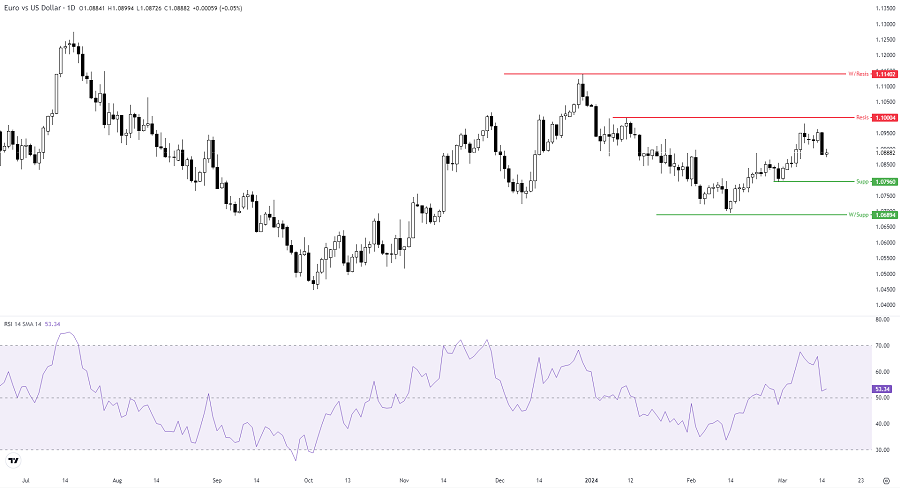
As we can see on the daily chart of EURUSD, there is a sideways movement between 1.11402 and 1.06894 which might refer to a balance between buyers and sellers and no clear trend.
short-term view: It might be better to wait until we find a clear trend in one way up or down.
USDJPY
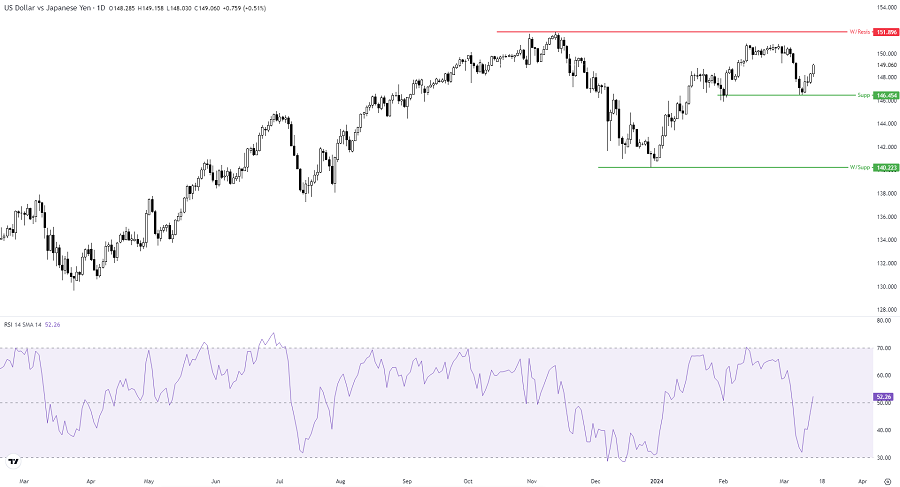
As we can see on the daily chart of USDJPY, there was a downward movement after rebounding from below 151.90 which is a weekly resistance level. It continued moving down and tested above 146.454 and rebounded before this level.
short-term view: it might take small short-term trades between 146.450 and 150.870 considering high risk and trade management or it might be better to wait until breaking above 151.90 to buy or below 145.80 to sell.
GBPUSD
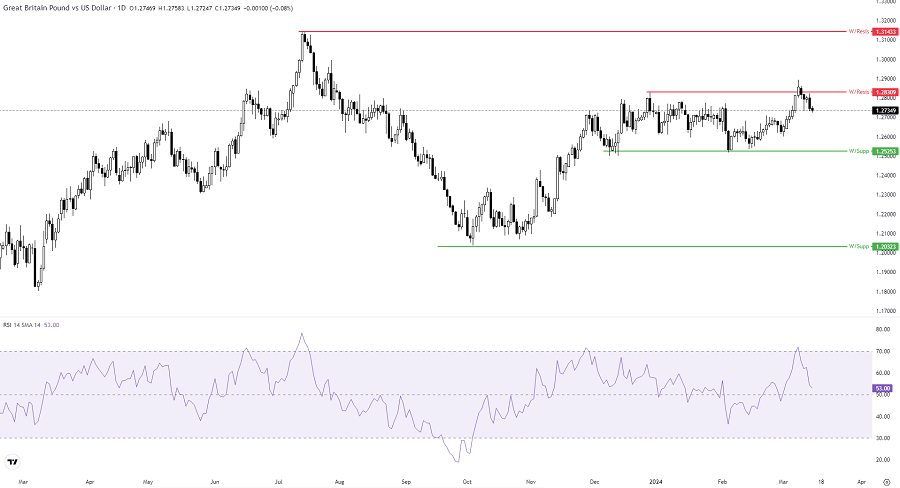
As we can see on the daily chart of GBPUSD, there is still a sideways movement between 1.2831 and 1.2532 which might refer to a balance between buyers and sellers.
short-term view: It might be better to take trades between these levels of sideways 1.2831 and 1.2532 or wait to find a clear trend above 1.2831 to buy or below 1.2532 to sell.
USDCHF
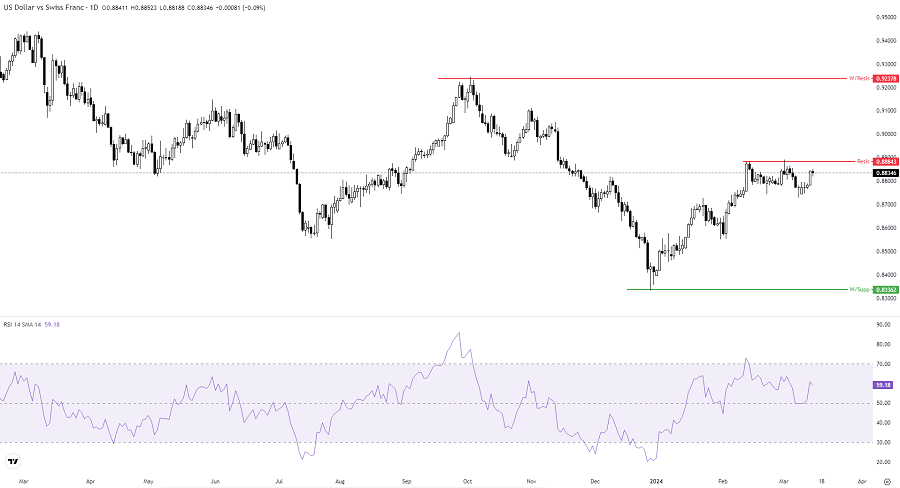
As we can see on the daily chart of USDCHF, there is a sideways or correction of the down movement from 0.92378 to 0.83362.
short-term view: It might be better to focus on selling positions below 0.87310 or 0.83360.
XAUUSD
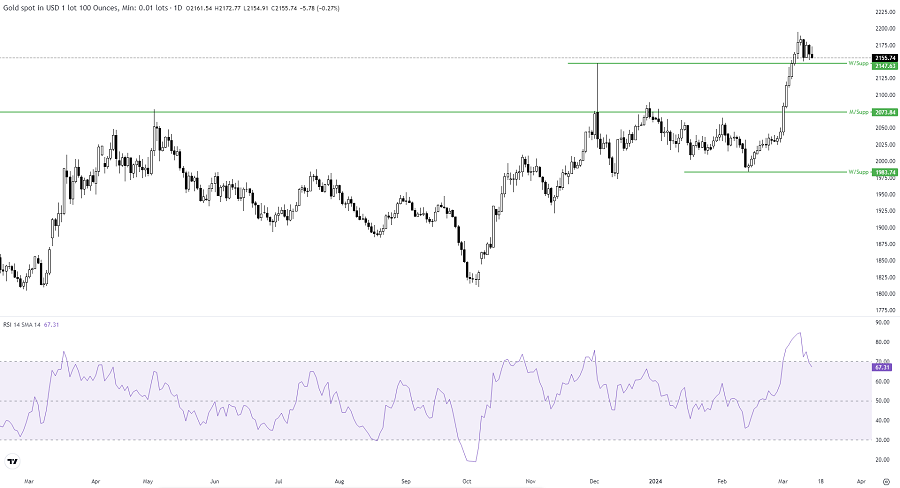
As we can see on the daily chart of Gold, there is up moving after breaking above 2147.63 then prices corrected to test this level from above and it might be a profit taking.
short-term view: It might be better to focus on buying positions if prices keep trading above the level of 2147.63.
Brent
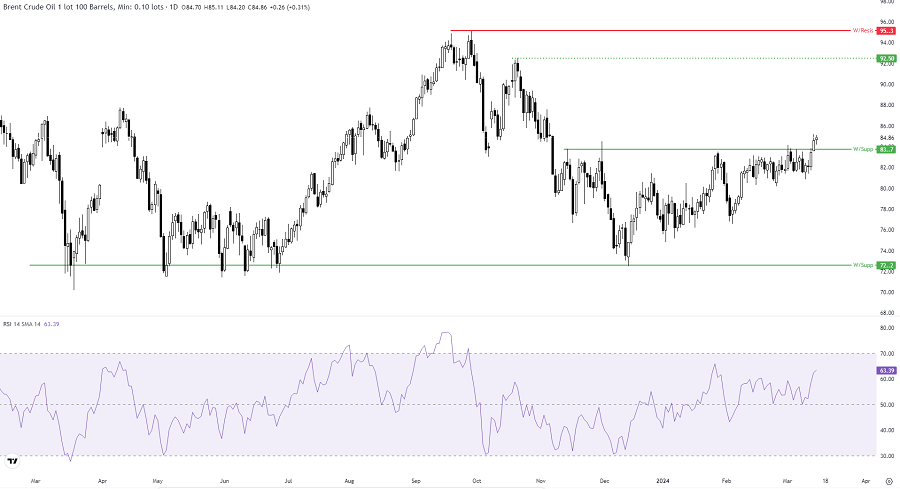
As we can see on the daily chart of Brent, There was a break above 83.7 which was a weekly resistance and became a support. It might see an upward movement if prices keep trading above this broken level.
short-term view: It might be better to focus on buying positions if prices keep trading above the level of 83.7.
US30
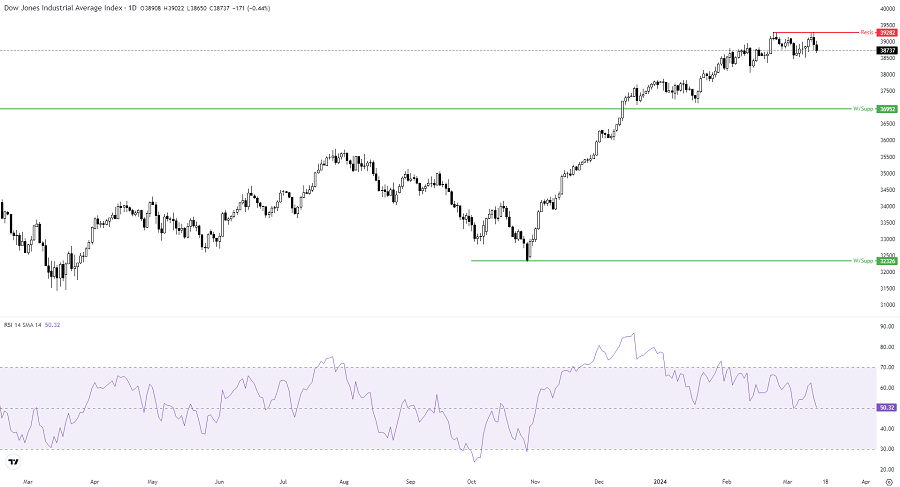
As we can see on the daily chart of the US30, there is still sideways movement which might be considered a correction after the last up movement for some profit-taking after breaking the weekly resistance around 36950 which became a support.
short-term view: It might be better to focus on buying positions if prices are above the level of 39285 and keep trading above it.
NAS100
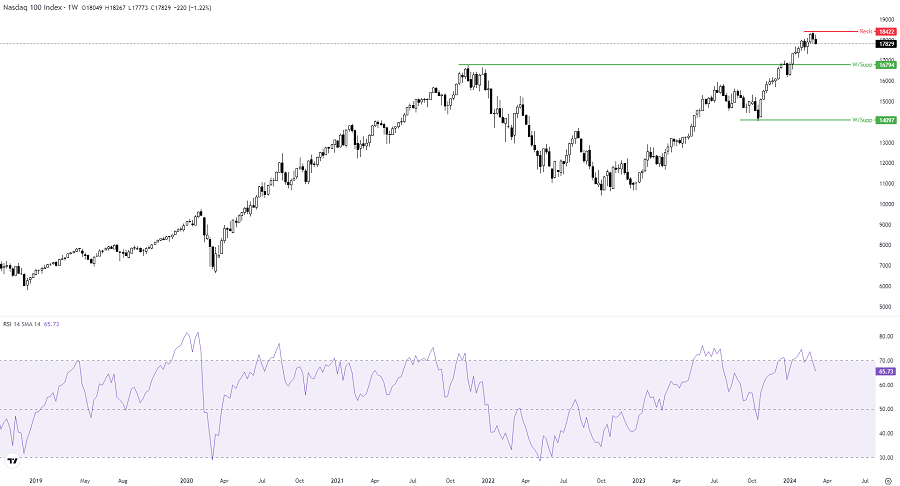
As we can see on the daily chart of the NAS100, there is still sideways movement which might be considered a correction after the last up movement for some profit-taking after breaking the weekly resistance around 16800 which became a support.
short-term view: It might be better to focus on buying positions if prices are above the level of 18425 and keep trading above it.
UK100
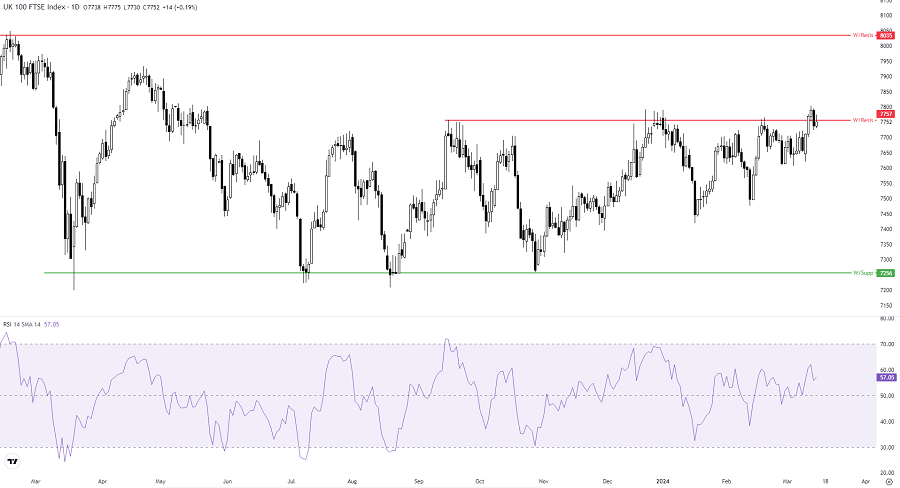
As we can see on the daily chart of UK100, there is still a sideways movement between 7760 and 7250 which means that there might be a balance between buyers and sellers.
short-term view: It might be better to wait to see buyers' or sellers' control and see a clear trend above 7760 might buy or below 7250 to might sell.
BTCUSD
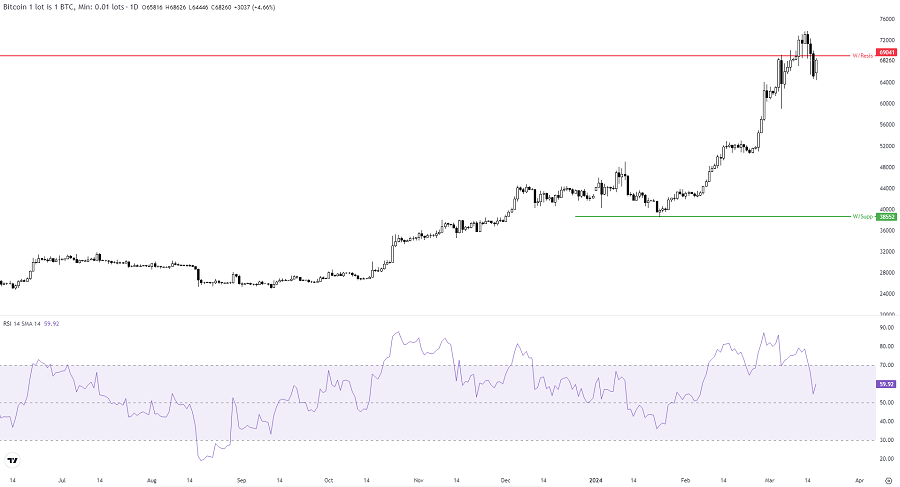
As we can see on the daily chart of BTCUSD, there might be a correction after breaking above 69080.70 which means that there might be a profit-taking.
short-term view: It might be better to focus on buying positions if prices continue trading above 69080.70 considering high risk and trade management.
ETHUSD
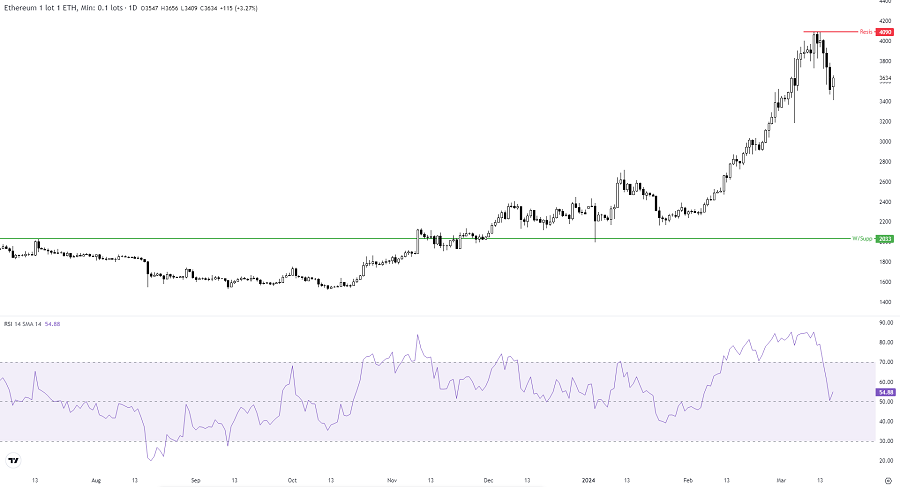
As we can see on the daily chart of ETHUSD, there is an up movement after breaking above the weekly resistance of 2033 which became a support which means that it might be a profit-taking.
short-term view: It might be better to focus on buying positions if prices continue trading above 3577.78 and 2720 considering high risk and trade management.
Any opinions, news, research, analyses, prices or other information contained on this website is provided as general market commentary and does not constitute investment advice. ThinkMarkets will not accept liability for any loss or damage including, without limitation, to any loss of profit which may arise directly or indirectly from use of or reliance on such information.

Learn and earn more today.
Visit our Education Center