Head and shoulders
 The head and shoulders pattern is one of the most anticipated chart patterns among traders, and can sometimes be found at the end of an uptrend.
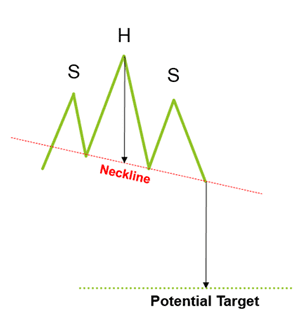
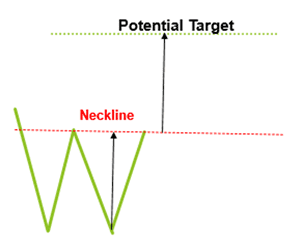
The pattern may be created during an uptrend, where the price rises and falls back down to a certain point, forming a peak known as the left shoulder. The price may then rebound and create a higher peak than the previous peak, and may then come back down to the support level of the first peak. The new peak is known as the head, and the support level that is now formed is known as the neckline. If the pattern fully forms, the price will bounce off the support and create a lower peak, known as the right shoulder.
When should you consider entering the market?
A potential place to enter the trade is on the confirmed break of the neckline – if the candle closes below the neckline, you could look to enter on the next candle, once it passes the low of the previous candle. Some traders tend to wait for a retest of the neckline (where the price will break through the neckline), and if this happens the price may then come back up to retest the neckline again.
If the price fails to break the neckline to the upside, however, a lower peak may form, which could suggest that the price is likely to head lower. The retest doesn’t happen all the time, though – there are times where the price will just travel straight through without retesting. It’s therefore recommended to test this strategy out before committing to it.
Potential profit targets are often measured from the head to neckline – this length may suggest a potential return for the price in the future.
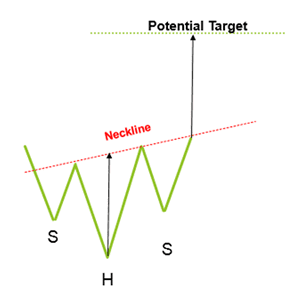
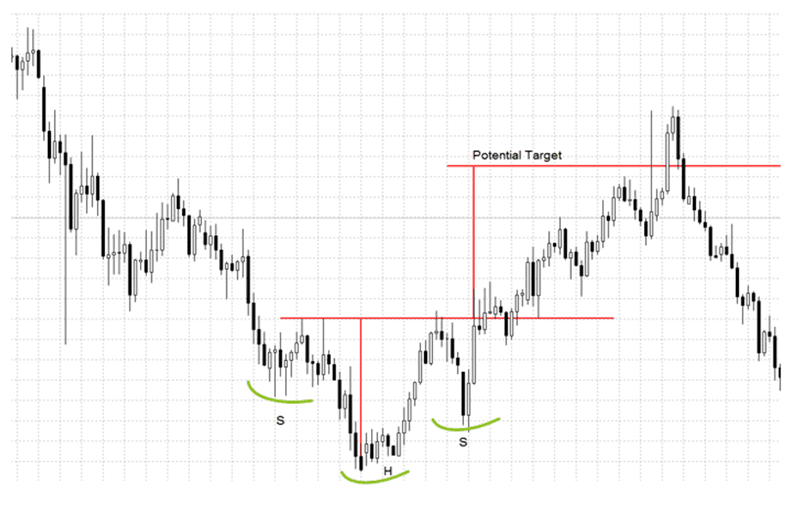
You may also experience an inverted head and shoulders, where the pattern appears at the bottom of the down trend. The inverted head and shoulder is created by forming a trough, followed by a lower trough, and finally a higher trough. To enter into a trade on this pattern, you may wish to wait for a confirmed break of the neckline, or wait to potentially see a retest of the neckline.
Double top
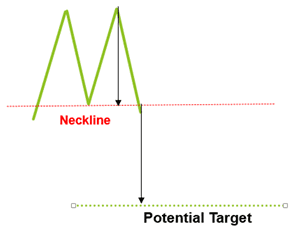
The double top pattern may appear at the top of an uptrend. It’s a bearish reversal pattern, and is formed by creating one peak, shortly followed by another peak at or around the same price. The neckline is created when the price forms a support level, and the pattern is complete when price breaks through the support level, or the neckline.
You can potentially enter on the break of the neckline, or wait for a failed re-test of the neckline, which will form a lower peak – giving you added confirmation that the price may head downwards.
Double bottom
The inverse to this pattern is a double bottom, which may appear at the bottom of a down trend and two troughs are created at or around the same price. This is a bullish reversal pattern. Again, you can potentially enter on the break of the neckline, or wait for a failed re-test of the neckline, forming a higher trough and giving you added confirmation that the price may head upwards.
 Flags
Flags
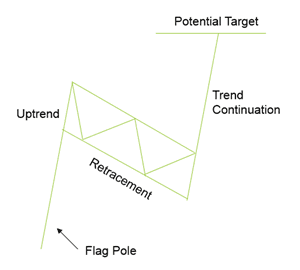
The flag pattern is a continuation pattern and may be located in either an uptrend or a down trend. The price doesn’t continually go up in an uptrend or down in a down trend – it needs to take a break, and you‘ll normally see the price retrace, before continuing with its trend.
In a bullish flag, you’ll find the price rise up before retracting. If you draw parallel lines above and below the price retracement, this will give you the shape of a flag. The price entry will be on the break of the top flag line, or you could wait for the retest of the flag line, creating a higher trough. This higher trough adds the potential of a successful trade. By measuring the uptrend and relaying the length of it to the bottom of the flag pattern, you’ll get your potential target.
The following chart shows a continuation of an uptrend with the flag pattern. As you can see, the price consolidates between the flag pattern before eventually breaking out.
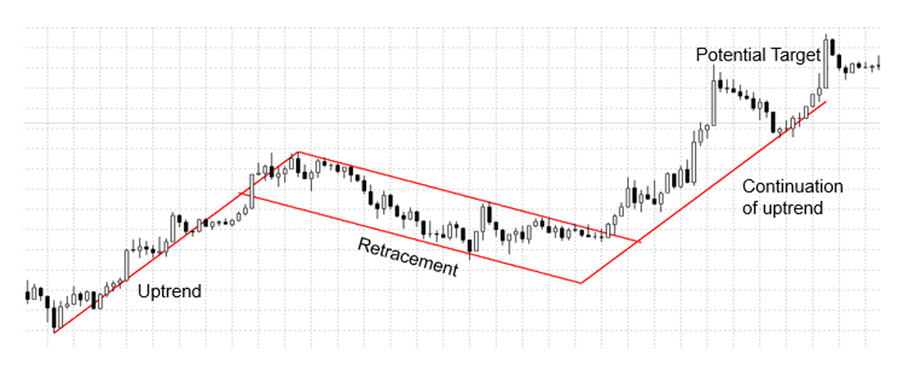
There are many other patterns that you can identify on the charts, but the charts covered here should get you started on the right track.