Please note ThinkMarkets does not provide CFD services to residents of the US.

Please note ThinkMarkets does not provide CFD services to residents of the US.

Learn To Trade
 
Indicators & Chart Patterns

Deepen your knowledge of technical analysis indicators and hone your skills as a trader.

Find your detailed guides here
Trading Glossary

From beginners to experts, all traders need to know a wide range of technical terms. Let us be your guide.

Learn more
Knowledge Base

No matter your experience level, download our free trading guides and develop your skills.

Learn more
Learn To Trade

Trade smarter: boost your skills with our training resources.

Create a live account
Market Analysis
 
Market News

All the latest market news, with regular insights and analysis from our in-house experts

Learn more
Economic Calendar

Make sure you are ahead of every market move with our constantly updated economic calendar.

Learn more
Technical Analysis

Harness past market data to forecast price direction and anticipate market moves.

Learn more
Live Webinars

Boost your knowledge with our live, interactive webinars delivered by industry experts.

Register now
Special Reports

Engaging, in-depth macroeconomic analysis and expert educational content from our in-house analysts

Learn more
Market Analysis

Harness the market intelligence you need to build your trading strategies.

Create a live account
Partnership
 
Affiliate Programme

Grow your business and get rewarded. Find out more about our Affiliate Programme today.

Learn more
Introducing Broker

ThinkMarkets ensures high levels of client satisfaction with high client retention and conversion rates.

Learn more
Proprietary Trading

Partner with us to build your own prop trading business. Enquire with our account managers today.

Learn more
White Label

We supply everything you need to create your own brand in the Forex industry.

Learn more
Regional Representatives

Partner with ThinkMarkets today to access full consulting services, promotional materials and your own budgets.

Learn more
Refer a friend

Receive $50 for you and your friend when you convert them into an active trader of ThinkMarkets.

Learn more
Partnership

Plug into the next-gen platforms and the trades your clients want.

Partner Portal
About ThinkMarkets
 
Sponsorships

Check out our sponsorships with global institutions and athletes, built on shared values of excellence.

Learn more
About Us

Find out more about ThinkMarkets, an established, multi-award winning global broker you can trust.

Learn more
Careers

Discover a range of rewarding career possibilities across the globe

Apply now
ThinkMarkets News

Keep up to date with our latest company news and announcements

Learn more
Trading Infrastructure

When it comes to the speed we execute your trades, no expense is spared. Find out more.

Learn more
Contact Us

Our multilingual support team is here for you 24/7.

Learn more
About ThinkMarkets

Global presence, local expertise - find out what sets us apart.

Create a live account
Log in Create account

What is the ADX indicator?

The Average Directional Movement Index, also known as ADX, is used to measure the strength of a trend.

The Average Directional Movement Index indicator represents an average of price ranges that are expanding. It features a line that moves up and down with several levels on a separate short window underneath a price graph, and measures the strength of price movement but doesn’t necessarily indicate the direction of movement. 

In other words, it measures pure strength using a simple scale.
Structure of the indicator and setting it up on MT4
The ADX measures the moving average of expansion of a price during a given amount of time.

While the default setting is the last 14 candles, some traders will adjust the input to their individual needs.

It is nondirectional, meaning that it simply measures whether a trend is strong or weak, and nothing more. It is plotted using a single line with a range that measures from 0 to 100. It measures the trend whether it is up or down and gives the traders some confidence as to whether or not a trend is likely to continue.

The ADX indicator

Notice that the built-in indicator has three different lines.

There are also parts of the indicator that were built into the original trading system but use the +DI and -DI calculations. However, forex traders typically only use the ADX indicator itself, ao the green and the red lines are often deleted.

The easiest way to do this is to right-click on the chart and select the ‘Indicators List’ menu.

After that, select the ‘Average Directional Movement Index’ indicator on the list, and then the ‘Colors’ tab.

From there, you can change the colors to ‘None.’ At this point, you will not see the lines anymore as shown on the chart just below.

The ADX simplified

Now that we have eliminated the peripheral indicators, traders can focus directly on the ADX.

The single line then will oscillate between 0 and 100, showing the strength of movement at that moment after calculating the average price expansion of the previous 14 candles.

In other words, the more the price starts to expand per candlestick, and therefore showing a stronger move, the higher this line will move on the chart.

Notice that there are spikes in the ADX value on both rallies and declines.
Join thousands of traders who choose a mobile-first broker.
Calculating the ADX
The ADX calculation is based on a moving average of a price’s expansion of price over the previous 14 candlesticks, or a period of your choice.

There are a few general guidelines:
  • Below 25: weak trend, or no trend at all
  • Between 25 and 50: strong trend
  • Between 50 and 75: very strong trend
  • Between 75 and 100: extremely strong trend

By looking at the reading, you can verify whether or not a trend is established, and whether or not a potential set up makes sense.

The ADX is typically used as a secondary indicator, but if a favorable candlestick set up that is during a reading that is relatively high, it only increases the odds in your favor.

If the ADX reads relatively low, it typically means that a market is consolidating, biding its time before forming the next trend.

Let’s look at the chart below.

Strong momentum on a break out

Notice that the market had relatively lower readings before spiking where it is circled.

You can see the market had formed three bullish candlesticks in a row as it broke out above a recent resistance level, but at the same time the ADX was strong.

Shortly before that, the market had been going somewhat sideways with a relatively soft ADX reading.
Using the ADX  One of the greatest advantages to using the ADX when trading forex is that it can set up a trader for a much larger run than they made you feel comfortable with.

For example, the chart below shows that we had an extremely negative candlestick in the Canadian dollar/Swiss franc currency pair.

That entry signal could have easily been taken, but the next several candlesticks were very choppy, and a lot of people may have been a bit nervous.

However, if they were paying attention to the ADX indicator they would have seen that it continued to turn higher, showing that in fact the underlying negative trend is picking up momentum, not losing it.

ADX traders would have stayed in the trade for quite some time, and then enjoyed the massive selloff that continued. Here’s another example:

ADX confirming momentum on a trend change

This is a perfect example of how the ADX can be used with traditional candlestick analysis.

This market formed a massive negative candlestick that would have attracted a lot of attention.

However, the average trader that wasn’t using this indicator more than likely would have gotten out of the trade far too early.

Notice that later on when the market broke down even further the ADX kept climbing. However, the ADX started to drop off again, signaling the trader that the trend may be running out of steam.

This shows that not only is the ADX a good indicator to stay in a trade, but it also can serve as a signal as to when you want to tighten up your stop loss, or perhaps even leave a trade as the original trading conditions have faded.
Practise trading with $25,000 virtual funds
Warnings and divergence
The ADX can also come into play when looking for divergence.

This is different to most indicators, because this is a situation where the markets not only could be traded against but could also indicate a trend is ending.

This means that you will be able to keep more of your profits if used properly. The underlying thesis is that momentum, and therefore price, is starting to calm back down in what has been a strong trend.

While many traders will look at candlesticks, where the support and resistance breaks, and moving averages to determine the entry or exit, many of them don’t understand that one of the bigger factors to pay attention to is momentum.

If the asset is moving slowly, this suggests that a currency pair is somewhat fairly valued, or at least not so much out of balance when it comes to pricing. However, when there is momentum that is strong and climbing, it means that prices are trying to get to a place where supply and demand equalizes.

In the chart below, notice the blue and red arrows.

Warning of a slowdown in momentum


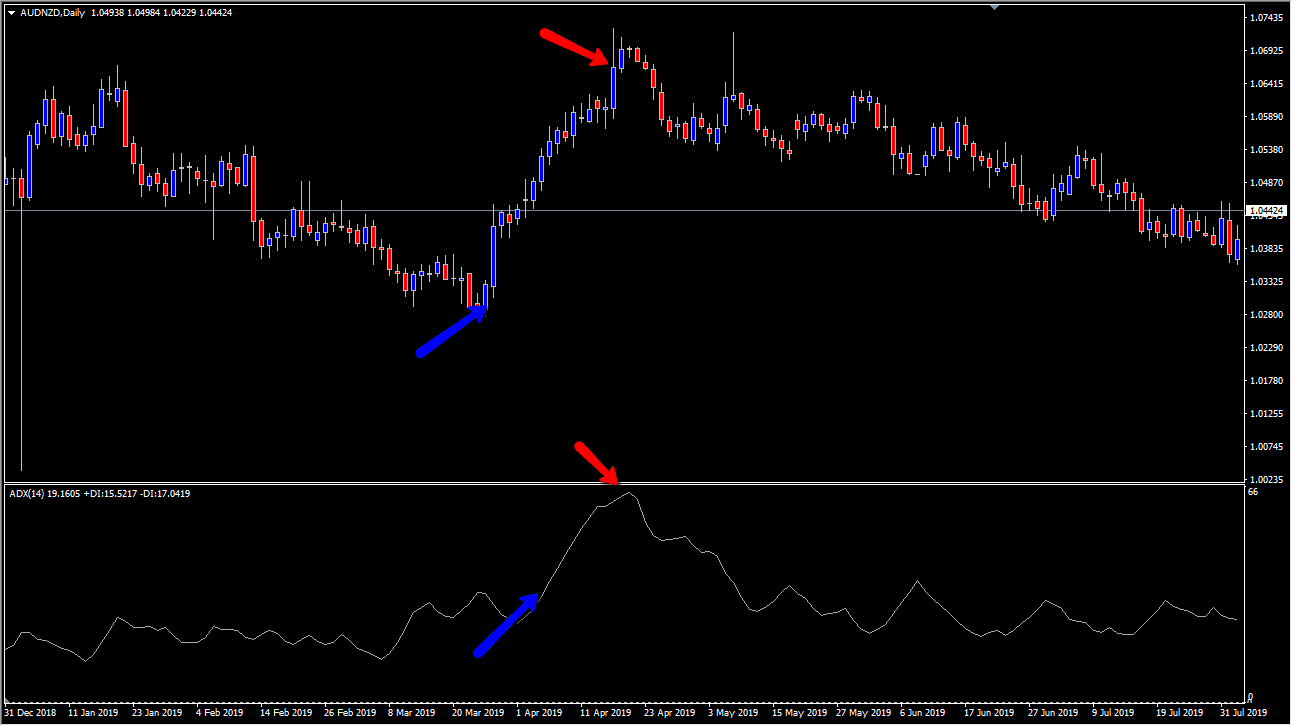
 The blue arrow shows that there was a large candle that traders could have taken as a buy signal, especially since the ADX started to rise higher.

This shows not only does the market look like it is breaking out, but it also is gaining momentum. Later on, the red arrows point out where the market started to slow down as the markets leveled off, and the ADX started to turn later.

The ADX started to paint the picture that the consolidation wasn’t going to continue the uptrend, and therefore the trader using ADX would have exited with more of the profits that the average trader would.

Let’s take a look at another chart.

Divergence on the ADX in order to avoid a trade


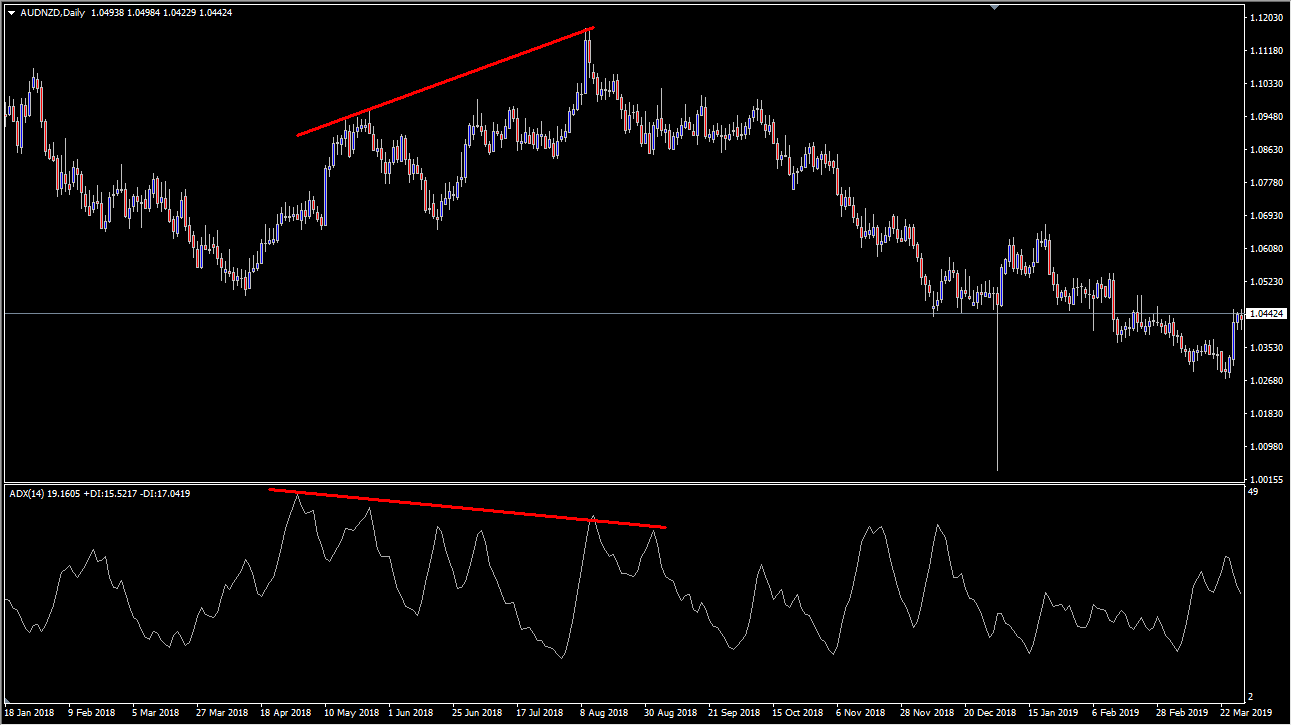
Divergence is when price is doing one thing, and momentum is doing the other. While most of the time traders will use oscillators to spot incidents of divergence, the ADX indicator also can be used as a sign when NOT to take a trade.

The chart above shows the Australian dollar/New Zealand dollar pair shows that it was going higher for a while, while the ADX readings continued to make lower higher. This means that although the momentum was going back and forth, the price was giving no sense of the underlying uncertainty.

If you use the ADX indicator, you probably know better than to get involved in the move to the upside. Shortly after this move was made, the market rolled right back over. This was a good warning for the trader to stay out in general. However, unlike some oscillators, divergence is typically used as a warning, not necessarily a trade signal.
Any opinions, news, research, analyses, prices or other information contained on this website is provided as general market commentary and does not constitute investment advice. ThinkMarkets will not accept liability for any loss or damage including, without limitation, to any loss of profit which may arise directly or indirectly from use of or reliance on such information.
Start trading GER40 from as low as 0.4 pips with ThinkTrader
Back to top