CFDs are complex instruments and come with a high risk of losing money rapidly due to leverage. 70% of retail investor accounts lose money when trading CFDs with this provider.
You should consider whether you understand how CFDs work and whether you can afford to take the high risk of losing your money.

Learn To Trade
 
Indicators & Chart Patterns

Deepen your knowledge of technical analysis indicators and hone your skills as a trader.

Find your detailed guides here
Trading Glossary

From beginners to experts, all traders need to know a wide range of technical terms. Let us be your guide.

Learn more
Knowledge Base

No matter your experience level, download our free trading guides and develop your skills.

Learn more
Learn To Trade

Trade smarter: boost your skills with our training resources.

Create a live account
Market Analysis
 
Market News

All the latest market news, with regular insights and analysis from our in-house experts

Learn more
Economic Calendar

Make sure you are ahead of every market move with our constantly updated economic calendar.

Learn more
Technical Analysis

Harness past market data to forecast price direction and anticipate market moves.

Learn more
Live Webinars

Boost your knowledge with our live, interactive webinars delivered by industry experts.

Register now
Special Reports

Engaging, in-depth macroeconomic analysis and expert educational content from our in-house analysts

Learn more
Market Analysis

Harness the market intelligence you need to build your trading strategies.

Create a live account
Partnership
 
Affiliate Programme

Grow your business and get rewarded. Find out more about our Affiliate Programme today.

Learn more
Introducing Broker

ThinkMarkets ensures high levels of client satisfaction with high client retention and conversion rates.

Learn more
White Label

We supply everything you need to create your own brand in the Forex industry.

Learn more
Regional Representatives

Partner with ThinkMarkets today to access full consulting services, promotional materials and your own budgets.

Learn more
Partnership

Plug into the next-gen platforms and the trades your clients want.

Partner Portal
About ThinkMarkets
 
Sponsorships

Check out our sponsorships with global institutions and athletes, built on shared values of excellence.

Learn more
About Us

Find out more about ThinkMarkets, an established, multi-award winning global broker you can trust.

Learn more
Careers

Discover a range of rewarding career possibilities across the globe

Apply now
Security of Funds

Security of your funds is our number one priority. We safeguard our Client funds in top tier banks.

Learn more
ThinkMarkets News

Keep up to date with our latest company news and announcements

Learn more
Trading Infrastructure

When it comes to the speed we execute your trades, no expense is spared. Find out more.

Learn more
Contact Us

Our multilingual support team is here for you 24/7.

Learn more
About ThinkMarkets

Global presence, local expertise - find out what sets us apart.

Create a live account
Log in Create account

A Complete Guide to Japanese Candlesticks

A Japanese candlestick is a technical tool used by traders to pack price information into a single candle. They are considered an extremely useful tool, since the traders are able to easily see and analyze a large amount of data.

Origins of the Japanese Candlesticks

Japanese candlesticks go back to as far as the 18th century. A Japanese trader Munehisa Homma traded rice in the local markets. He also served as an adviser to Japanese government. 

Homma started recording prices of rice on a daily basis, including opening price, high, low, and close. After some time, he started noticing patterns that were repetitive.

In 1755, he wrote a book titled The Fountain of Gold — The Three Monkey Record of Mone, discussing the psychological aspects of the trading process. 

He is believed to be the first person to realize that the behaviour of other participants in the market is a crucial element in trading. The emotions of traders play a huge part in their decisions. Homma realized this and took advantage while trading the rice. 

Homma is also known for introducing the Sakata Rules, a set of five rules that outline patterns developed by local traders. It is exactly this set of rules that created the basis for the birth of Japanese candlesticks. 

It was not until the end of the previous century that Steve Nison introduced the concept of Japanese candlesticks to the wider public in a classic investing book titled Japanese Candlestick Charting Techniques.

The essence of this concept is the psychology of a trader, which we will discuss in detail below.

The key elements of Japanese Candlesticks

A Japanese candlestick consists of four main elements: 

  • Opening price 

  • Highest point reached by the asset’s price

  • Lowest point reached by the asset’s price

  • Closing price of the candle


structure of a Japanese candlestick


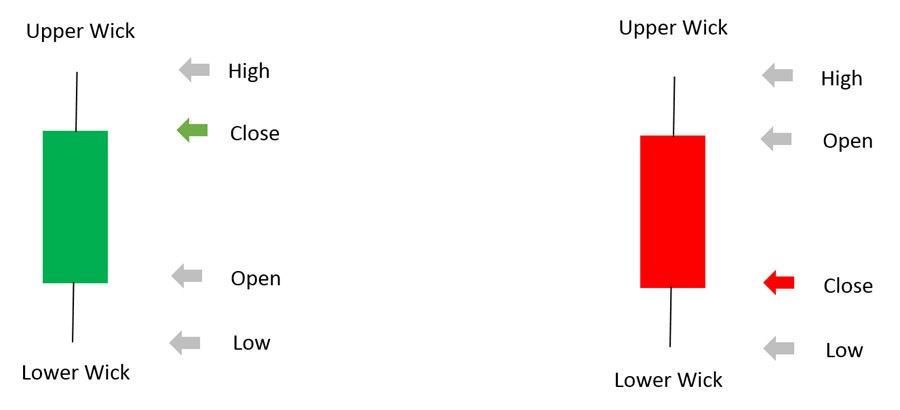
As seen in the photo above, the four elements create two parts of the candle: the wick (extending up and down) and the body that consists of the opening and closing prices. The wick can be long or short, depending on the price movements.

As such, candlesticks differ from the simple bar charts by displaying more information, but in such a way that they are still easy to read. 


narrow- and wide-spread candlestick


Traders usually use either green (bullish) or red (bearish) colour to paint the candlestick, although some also use white (bullish) and black (bearish) as well.


green (bullish) and red (bearish) colors


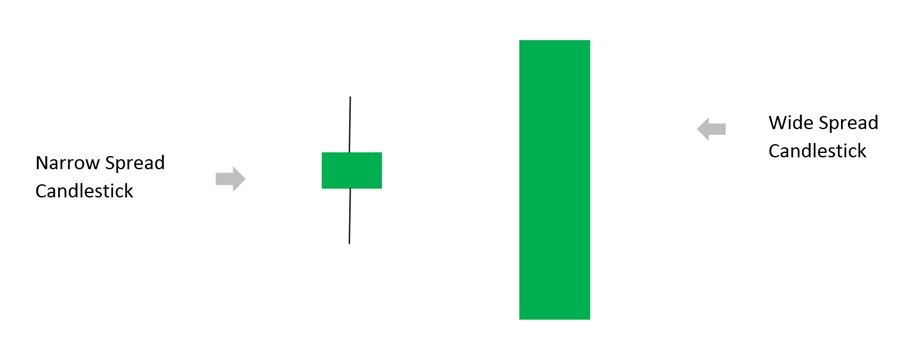
As seen in the photo above, the bullish candle  is formed when the close is higher than the open, and the opposite is the case for the bearish candle. There is a wide range of different shapes, from those with long wicks to either side to those with almost no body. 

The top of the upper wick shows the session’s high and vice versa. The longer the distance between the high and the low, the wider the price range of the given session is. 

You can test how different Japanese candlestick patterns work by trading without risking your  capital first, by opening a demo trading account

What the Japanese candlesticks tell you

As noted earlier, the Japanese candlesticks are important as they display data to traders that reflect the state of the market. Based on the key elements, traders can better understand the prevailing trend in the market and which side has the upper hand. 

Looking at the image above, we see the EUR/USD daily chart. At the right end of the chart we see a series of long and green candles. This type of candle is very strong as the body is long and the close is usually near the top of the candle. It means that the bulls are in control of the price action as they could facilitate a series of wins that brought them huge gains. 

A clean uptrend, which is characterized by a series of higher highs and higher lows, sends a message that there is a continuous interest from the side of buyers to push the price higher. On the other hand, the long and red candles are a sign of strong selling pressure. 

It is exactly the relationship between individual candlesticks that creates patterns that help traders predict future price changes. 

The most popular candlestick patterns 

There are two major groups of candlestick patterns: bullish vs bearish, and then there are reversal, transitional and continuation patterns. Patterns also differ based on the number of candles, starting from a single-candle formation to those consisting of two and three candles. 

Bullish patterns are those that predict that the price of an asset is likely to rise while the latter indicate the price is likely to fall. A reversal pattern signals a potential change in direction, while the continuation, as the name itself says, signals an extension of the current trend. 

In the section below, we will discuss the five most powerful candlestick patterns used by traders to predict price movements and make profits. All of these patterns generate a sign or message only, and you should consult other technical indicators before you engage in a trade.

For this purpose, we have prepared detailed guides to explain the best candlestick patterns with examples and how to use them in your trading strategy. See a short summary for the most popular ones below or just follow the links here to the detailed guides gain deeper understanding:

Any opinions, news, research, analyses, prices or other information contained on this website is provided as general market commentary and does not constitute investment advice. ThinkMarkets will not accept liability for any loss or damage including, without limitation, to any loss of profit which may arise directly or indirectly from use of or reliance on such information.
Back to top