Shares
 
FAQs

Visit our FAQ page to find the answers to the most commonly asked questions, including how to create an account, explaining ETFs, and providing useful links, forms, and tables.

FAQs
Shares

Start investing in Australian shares the smart way. Discover ThinkTrader today.

Open Shares Account
Learn To Trade
 
Indicators & Chart Patterns

Deepen your knowledge of technical analysis indicators and hone your skills as a trader.

Find your detailed guides here
Trading Glossary

From beginners to experts, all traders need to know a wide range of technical terms. Let us be your guide.

Learn more
Knowledge Base

No matter your experience level, download our free trading guides and develop your skills.

Learn more
Learn To Trade

Trade smarter: boost your skills with our training resources.

Create a live account
Market Analysis
 
Market News

All the latest market news, with regular insights and analysis from our in-house experts

Learn more
Economic Calendar

Make sure you are ahead of every market move with our constantly updated economic calendar.

Learn more
Technical Analysis

Harness past market data to forecast price direction and anticipate market moves.

Learn more
Live Webinars

Boost your investing knowledge with our live, interactive webinars delivered by industry experts.

Register now
Special Reports

Engaging, in-depth macroeconomic analysis and expert educational content from our in-house analysts

Learn more
Market Analysis

Harness the market intelligence you need to build your trading strategies.

Create a live account
Partnership
 
Money Manager

Increase your income and get compensated for your trading knowledge with ThinkInvest, putting you in control.

Learn more
Introducing Broker

ThinkMarkets ensures high levels of client satisfaction with high client retention and conversion rates.

Learn more
White Label

We supply everything you need to create your own brand in the Forex industry.

Learn more
Regional Representatives

Partner with ThinkMarkets today to access full consulting services, promotional materials and your own budgets.

Learn more
Partnership

Plug into the next-gen platforms and the trades your clients want.

 
About ThinkMarkets
 
Sponsorships

Check out our sponsorships with global institutions and athletes, built on shared values of excellence.

Learn more
About Us

Find out more about ThinkMarkets, an established, multi-award winning global broker you can trust.

Learn more
Negative Balance Protection

Trade with peace of mind. Never lose more than what you deposited, no matter what the market conditions.

Learn more
Careers

Discover a range of rewarding career possibilities across the globe

Apply now
ThinkMarkets News

Keep up to date with our latest company news and announcements

Learn more
Trading Infrastructure

When it comes to the speed we execute your trades, no expense is spared. Find out more.

Learn more
Contact Us

Our multilingual support team is here for you 24/7.

Learn more
About ThinkMarkets

Global presence, local expertise - find out what sets us apart.

Create a live account
Log in Create account

Fibonacci ratios

Fibonacci retracements are ratios which allows you to identify potential reversal levels. Here we’ll look at these retracements in a bit more detail.

The Fibonacci ratios commonly used are 100%, 61.8%, 50%, 38.2%, 23.6% - these are shown as horizontal lines on a chart and may identify areas of support and resistance. These levels are created by drawing a trend line between two extreme points and diving the vertical distance by the key Fibonacci ratios. These extreme levels are known as the recent swing high and swing low, 

To identify the Fibonacci levels for an uptrend, click on the swing low and draw the trend line to the swing high. In a down trend you simply reverse the trend line. The following chart shows the Fibonacci levels on price which is in an uptrend.

Fibonacci Retracement

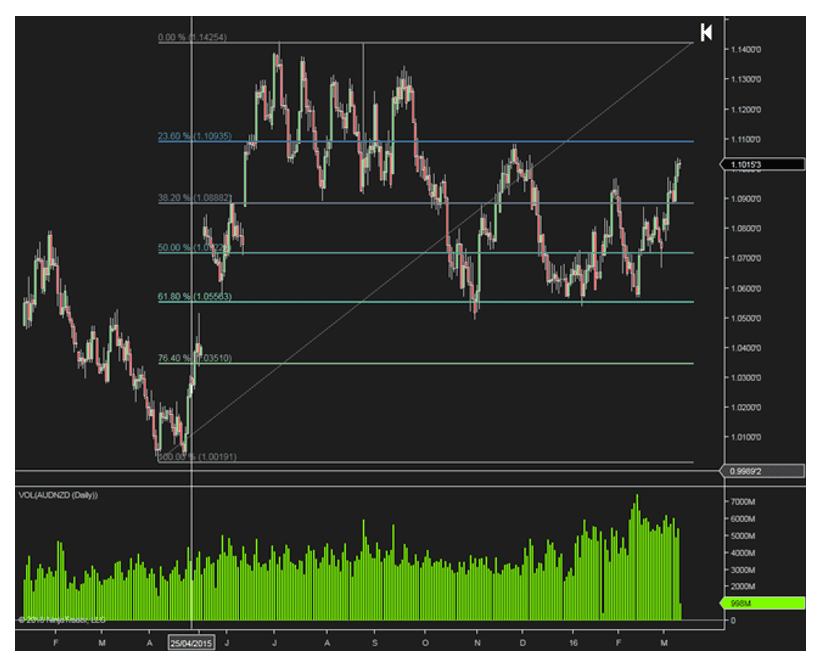
As you can see on the chart, we have plotted the Fibonacci levels by clicking on the swing lows at 1.000 and swing highs at 1.14. The Fibonacci levels plotted show where price travels to and reverses, and are evident at the 61.8%, 38.2% and 23.6% levels. The 61.8% level is a common support level, as in the above example you can see the price has tested this level on many occasions. More recently, you can see where the price broke through the 38.2% level and retested this level. In this example there’s an expectation for the currency pair to test the 23.6% level at 1.11.

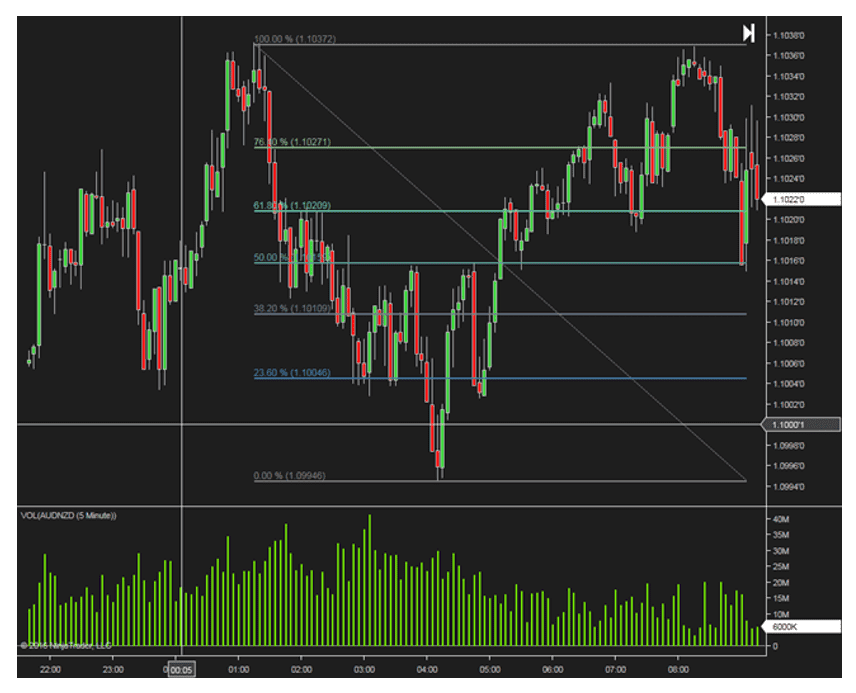
The next chart shows the Fibonacci ratios plotted for the pricing action in a down trend.  As you can see, we’ve drawn a trend line from the swing high at 1.1037 to the swing low at 1.0994. Again, you can clearly see where the price reversed at key Fibonacci levels such as the 50% and 23.6% levels.

Fibonacci Retracement

Fibonacci levels are by no means fool proof – they’re not areas where you would buy and sell from. You should look at them as areas of interest – an indication of where the price may go to in the future.

Combining Fibonacci ratios with support and resistance

Fibonacci ratios can be subjective, but can also be used to identify key support and resistance levels. A potential way to use the Fibonacci levels is to spot potential support and resistance levels, and see if these levels line up with the Fibonacci levels. If you do spot these levels, the chances of the price bouncing off them are higher.

Fibonacci Retracement

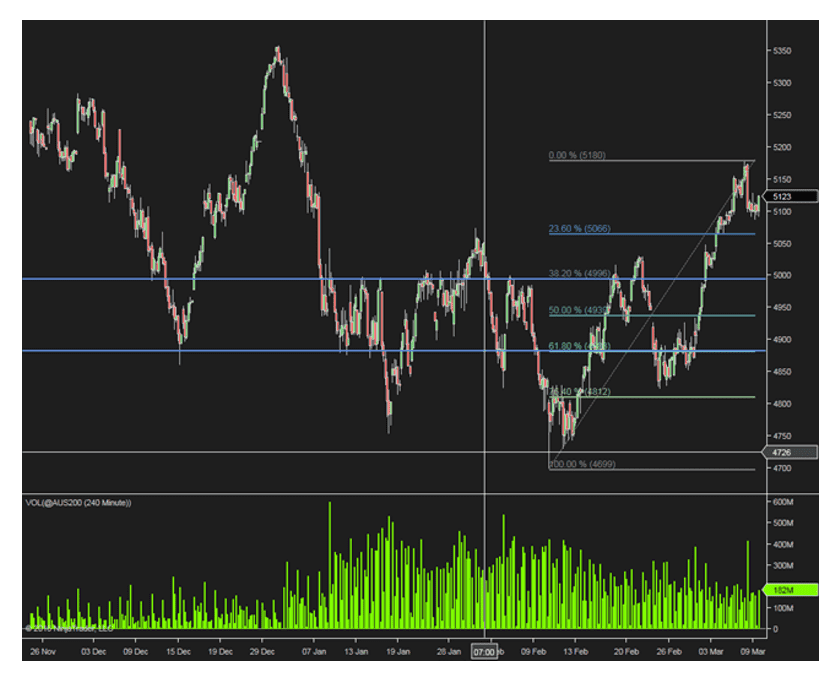
As you can see from the chart, the key Fibonacci levels 61.8% and 38.2% have been areas of support and resistance previously, and by identifying this on the chart, these levels can potentially be areas where you could enter the market. With traders looking at the same support and resistance levels, there’s a good chance that there will be a number of orders around those levels. 
 

Back to top